What Home Features Add the Most Value?
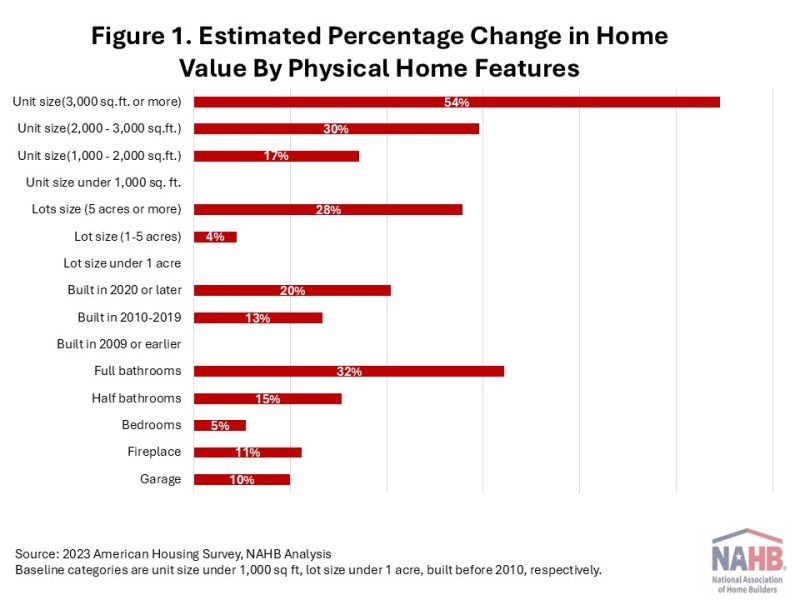
Web Master2025-11-17T08:16:03-06:00The value of a single-family home is shaped by many factors, but its physical features remain among one of the most influential. Using the latest 2023 American Housing Survey (AHS), this study focuses on which home features genuinely boost single-family detached home values and by how much. Key findings show that the overall square footage of the home and the number of bathrooms stand out as especially strong value drivers, while other features such as the number of bedrooms and the presence of amenities also play a role. In this first part of our two-part blog series, we focus on the physical features of single-family homes. The second part will explore how location and neighborhood quality further influence home values across the United States. Home size is one of the strongest value drivers in today’s housing market, as shown in Figure 1. Compared with smaller homes under 1,000 sq. ft., homes between 1,000 and 2,000 sq. ft. are valued about 17% higher. Moving up to homes between 2,000-3,000 sq. ft. increases value by around 30%, while homes with 3,000 sq. ft. or more adds 55% more to the market value. These effects are measured after accounting for differences in region, age of structure, and other key features. While both the number of bathrooms and bedrooms contribute to single-family home values, the number of bathrooms has a larger impact. Each additional full bathroom increases home value by approximately 32%, compared to about 5% for an additional bedroom, holding the square footage and other features constant. Even a half bathroom brings meaningful returns, adding an estimated 15%. The age of the home is also a contributing factor to the final market value, even after accounting for other features and neighborhood conditions. Compared to homes built before 2010, homes built between 2010 and 2019 have 13% higher values, and homes built after 2020 are valued 19% higher. These premiums likely reflect improvements in energy efficiency, insulation, and modern building systems that are appealing to more buyers. Other amenities also bring solid returns, like garages, fireplaces, and centralized air conditioning. Garages add around 10% to home value; Besides a protected parking space, garages offer the flexibility for additional storage or turning it into a workshop/hobby space. Having a fireplace can add value to a home, increasing its value by around 10%. It is appealing to some home buyers, as it not only provides a cozy ambiance, but also could reduce heating costs in some regions. Centralized AC adds about 7% to home value nationwide, but its impact varies across the divisions. In the South, including the South Atlantic, East South Central, and West South divisions, centralized AC adds 23%, 40%, and 48% more values, respectively. Please click here to be redirected to the full special study.