Credit Conditions for Builders Tighten
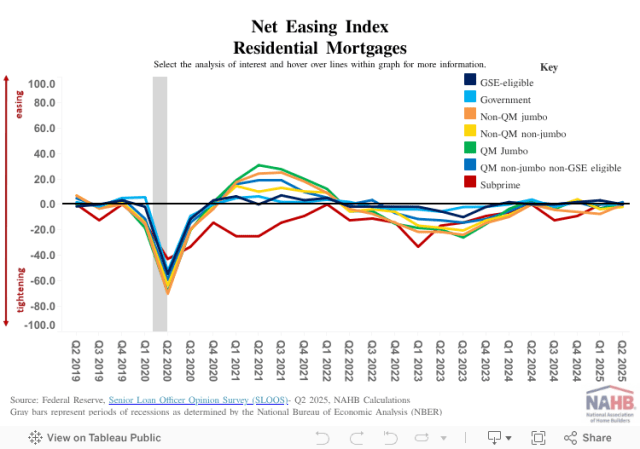
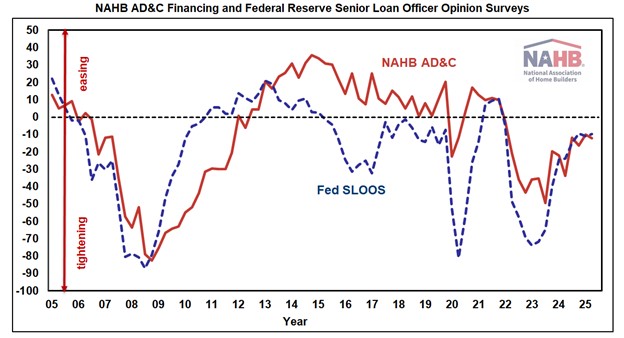
Paul Emrath2025-08-15T08:16:00-05:00For the fourteenth consecutive quarter, builders and developers reported tighter credit conditions on loans for residential Land Acquisition, Development & Construction (AD&C) in NAHB’s quarterly survey on AD&C Financing. In the second quarter of 2025, the NAHB survey’s net easing index posted a reading of -12.3 (the negative number indicating that credit tightened since the previous quarter). This is in reasonably close agreement with the second quarter reading of -9.7 for the similar net easing index derived from the Federal Reserve’s survey of senior loan officers. Like the NAHB net easing index, the one from the Fed has been in negative territory (indicating credit tightening) for fourteen consecutive quarters. Over the past year the additional tightening indicated by both indices has been relatively modest, with index levels hovering between -20 and 0. Modest or not, however, after fourteen straight quarters of tightening, many builders are probably wondering how much room lenders have left to tighten further. More details from the Fed’s survey of lenders—including measures of demand and net easing for residential mortgages—appeared in a previous post. According to NAHB builders, the most common ways lenders tightened credit on AD&C loans in the second quarter were by reducing the amount they are willing to lend (cited by 60% of the builders who reported tighter credit), requiring personal guarantees (53%), increasing the interest rate and not making new loans (47% each), and increasing documentation requirements (40%). Also in the second quarter, the cost of credit declined on loans made specifically for residential land acquisition (the “A” in AD&C). The average contract interest rate on the loans declined from 8.23% to 7.82%, while the average initial points dropped from 0.71% to 0.56%. As a result, the average effective interest rate (which takes both the contract rate and initial points into account) on land acquisition loans declined from 10.68% to 9.95%. For the other three categories of AD&C loans tracked in the NAHB survey, credit became more expensive since the previous quarter. The average contract interest rate increased on loans for land development (from 7.86% to 8.04%) and speculative single-family construction (from 8.08% to 8.17%), while declining only slightly (from 7.96% to 7.95%) on loans for pre-sold single-family construction. Meanwhile, average initial points were unchanged at 0.74% on loans for land development, but increased from 0.68% to 0.72% on loans for speculative single-family construction, and from 0.45% to 0.58% on loans for pre-sold single-family construction. Those combinations of quarter-to-quarter changes took the effective interest up from 11.50% to 11.77% on loans for land development, from 12.59% to 12.82% on loans for speculative single-family construction, and from 12.49% to 12.73% on loans for pre-sold single-family construction. Although the average effective interest rate was higher in 2025 Q2 than in 2025 Q1 for three of the four categories of AD&C loans, the rate was down year-over-year for all four. Financing costs for builders and developers could decline further over the next quarter, especially if (as NAHB expects) the Federal Reserve reduces the target federal funds rate at its September meeting. In fact, as discussed in NAHB’s post on the Fed’s July meeting, a reduction in construction financing costs rather than an effect on mortgage rates is the main benefit builders can expect from easier monetary policy. More detail on credit conditions for residential builders and developers is available on NAHB’s AD&C Financing Survey web page. Discover more from Eye On Housing Subscribe to get the latest posts sent to your email.