Sales of Lower-Priced New Single-Family Homes Declined Over the Past Five Years
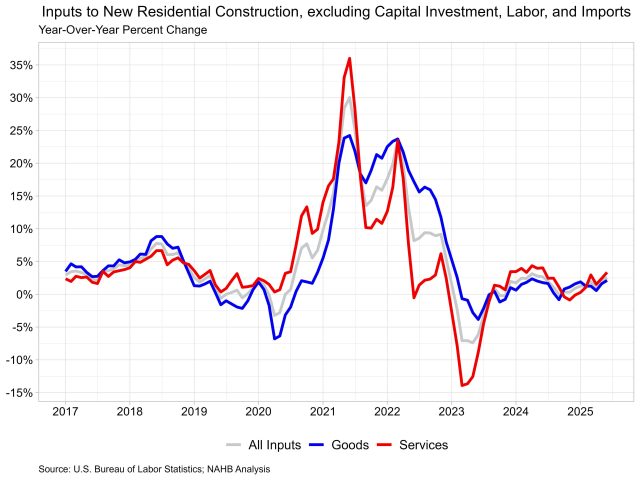
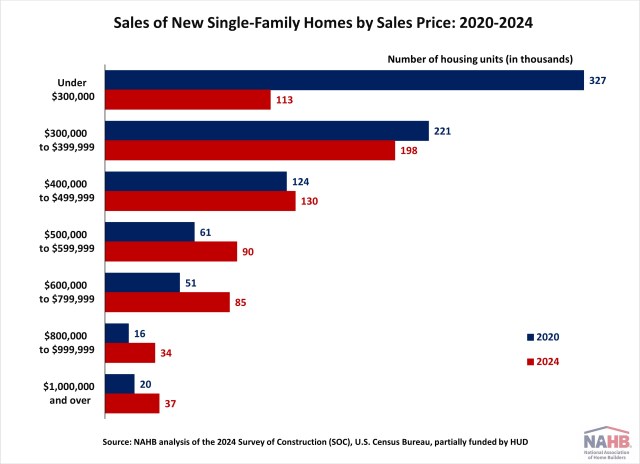
Jing Fu2025-07-21T09:29:41-05:00From 2020 to 2024, sales of lower-priced new homes declined significantly as the market moved toward higher-priced segments. Rising construction costs—driven by inflation, supply chain disruptions, and labor shortages—as well as higher regulatory costs, made it increasingly difficult for builders to construct affordable homes. On the other hand, low levels of inventory pushed up the price of new single-family homes, deepening the housing affordability crisis for first-time and middle-income buyers. National New Home Sales by Sales Price Data from the U.S. Census’s Survey of Construction (SOC) shows that total sales of new single-family homes declined by 17% during the 2020—2024 period. Meanwhile, the median sales price of new single-family homes increased significantly, rising from $330,900 in 2020 to $420,300 in 2024. This steep rise in sales price has placed additional pressure on prospective home buyers, particularly those seeking homes in the lower-priced segments. Between 2020 and 2024, the market for new single-family homes experienced significant shifts in the distribution of sales by price range. Most notably, there was a sharp decline in sales of lower-priced homes. Homes priced under $300,000 experienced a 65% decline in sales, while sales of homes priced between $300,000 and $399,999 fell by 10%. In contrast, higher-end segments saw substantial growth, with sales of homes priced between $800,000 and $999,999 more than doubling and those priced at $1,000,000 or more increasing by 85%. The market share of lower-priced homes declined dramatically. In 2020, homes priced under $300,000 accounted for 40% of the total new single-family home sales, making them a dominant category. By 2024, this category had dropped to the third largest, overtaken by homes in the $300,000—$399,999 and $400,000—$499,999 ranges. Meanwhile, the share of higher-priced homes expanded, reflecting a broader shift toward more expensive construction and away from affordability. Regional New Home Sales by Sales Price The regional picture mirrors these national trends, though the magnitude and affected price category vary by geography. Between 2020 and 2024, all four regions—the Northeast, Midwest, South, and West—saw declines in new home sales. The West experienced the steepest drop at 28%, followed by the Midwest at 14%, the South at 13%, and the Northeast at 8%. The declines mainly reflect significant declines in lower-priced home sales. In the Midwest and South, the declines in new home sales were limited to homes priced under $300,000. In the Northeast and West, where the regions tend to have higher median home prices, sales declines occurred in multiple price categories. The Northeast saw a broader decline in new homes sold under $600,000, while new home sales in the West reported declines in three price categories under $500,000. Furthermore, all four regions also experienced a decline in the market share of lower-priced homes. In 2020, more than half of the new homes sold in the Midwest and South were priced under $300,000. By 2024, that share had plummeted to just 16% in the Midwest and 23% in the South. The Northeast and West also saw notable shifts, with the share of homes priced between $300,000 and $499,999 dropping sharply over the same period. Discover more from Eye On Housing Subscribe to get the latest posts sent to your email.