June Single-Family Permits Slumps, Multifamily Gains

2025-08-15T09:17:49-05:00

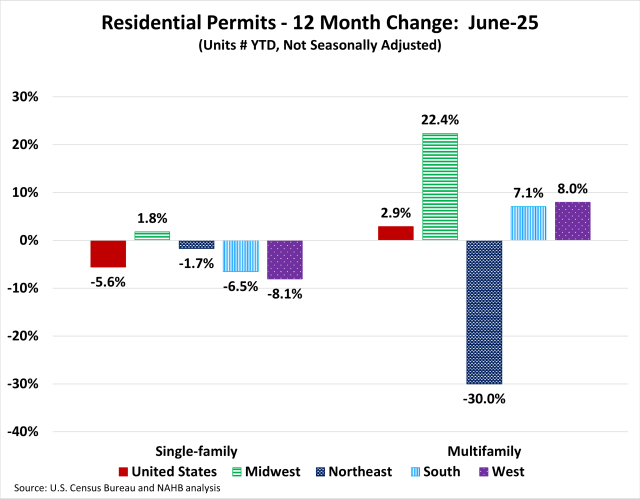
Single-family housing permits continued a downhill trend for the sixth month in a row. The continuous decline in single-family permits highlights persistently weak housing demand, tied to affordability challenges like high mortgage rates. Builders appear cautious amid economic uncertainty, labor constraints, and rising inventories. The uptick in multi-family permits suggests a potentially stabilizing trend, though it’s important to note its volatility. The housing market’s mixed signals—weak single-family coupled with some resilience in multi-family—could mean continued drag on residential investment and the broader economy this year. Over the first six months of 2025, the total number of single-family permits issued year-to-date (YTD) nationwide reached 485,935. On a year-over-year (YoY) basis, this is a decline of 5.6% over the June 2024 level of 514,728. For multifamily, the total number of permits issued nationwide reached 244,812. This is 2.9% higher compared to the June 2024 level of 237,935. Year-to-date ending in June, single-family permits were up in one out of the four regions. The Midwest posted a small increase of 1.8%. The Northeast was 1.7% lower, the South was down by 6.5%, and the West was down by 8.1% in single-family permits during this time. For multifamily permits, three out of the four regions posted increases. The Midwest was up by 22.4%, the West was up by 8.0%, and the South was up by 7.1%, Meanwhile, the Northeast declined steeply by 30.0%, driven by the New York-Newark-Jersey City, NY-NJ MSA which declined by 40.0%. Between June 2025 YTD and June 2024 YTD, 15 states posted an increase in single-family permits. The range of increases spanned 19.9% in Hawaii to 0.2% in Kentucky. The remaining 35 states and the District of Columbia reported declines in single-family permits with the District of Columbia reporting the steepest decline of 24.2%. The ten states issuing the highest number of single-family permits combined accounted for 63.0% of the total single-family permits issued. Texas, the state with the highest number of single-family permits, issued 78,104 permits over the first six months of 2025; this is a decline of 8.0% compared to the same period last year. The second highest state, Florida, decreased by 10.6%, while the third highest, North Carolina, posted a decline of 0.9%. Between June 2025 YTD and June 2024 YTD, 29 states recorded growth in multifamily permits, while 21 states and the District of Columbia recorded a decline. Iowa (+165.5%) led the way with a sharp rise in multifamily permits from 1,178 to 3,128, while Alabama had the largest decline of 49.6% from 1,788 to 901. The ten states issuing the highest number of multifamily permits combined accounted for 61.8% of the multifamily permits issued. Over the first six months of 2025, Florida, the state with the highest number of multifamily permits issued, experienced an increase of 25.0%. Texas, the second-highest state in multifamily permits, saw an increase of 14.1%. California, the third largest multifamily issuing state, increased by 11.5%. At the local level, below are the top ten metro areas that issued the highest number of single-family permits. For multifamily permits, below are the top ten local areas that issued the highest number of permits. Discover more from Eye On Housing Subscribe to get the latest posts sent to your email.

June Single-Family Permits Slumps, Multifamily Gains2025-08-15T09:17:49-05:00

Permits Falls in May 2025

2025-07-16T09:16:42-05:00

Housing permits continued a downhill trend for the fifth month in a row, pointing to a broader residential construction slowdown for 2025. This slowdown is attributed to factors like higher mortgage rates, tariff concerns, and challenges about future housing demand due to economic uncertainty. Over the first five months of 2025, the total number of single-family permits issued year-to-date (YTD) nationwide reached 404,977. On a year-over-year (YoY) basis, this is a decline of 6.1% over the May 2024 level of 431,196. For multifamily, the total number of permits issued nationwide reached 195,561. This is essentially unchanged from the May 2024 level of 195,932. Year-to-date ending in May, single-family permits were up in two out of the four regions. The Midwest and the Northeast posted small increases of 0.9% and 0.7% respectively. The South was down by 7.6% and the West was down by 7.4% in single-family permits during this time. For multifamily permits, three out of the four regions posted increases. The Midwest was up by 20.0%, the West was up by 5.2%, and the South was up by 3.5%, Meanwhile, the Northeast declined steeply by 31.2%, driven by the New York-Newark-Jersey City, NY-NJ MSA which declined by 42.0%. Between May 2025 YTD and May 2024 YTD, 16 states posted an increase in single-family permits. The range of increases spanned 26.2% in Hawaii to 0.4% in Pennsylvania. The remaining 34 states and the District of Columbia reported declines in single-family permits with New Mexico reporting the steepest decline of 24.5%. The ten states issuing the highest number of single-family permits combined accounted for 63.2% of the total single-family permits issued. Texas, the state with the highest number of single-family permits, issued 66,055 permits over the first five months of 2025; This is a decline of 8.7% compared to the same period last year. The second highest state, Florida, decreased by 12.2%, while the third highest, North Carolina, posted a decline of 3.9%. Between May 2025 YTD and May 2024 YTD, 27 states recorded growth in multifamily permits, while 23 states and the District of Columbia recorded a decline. Iowa (+168.0%) led the way with a sharp rise in multifamily permits from 781 to 2,093, while Alabama had the biggest decline of 54.7% from 1,676 to 760. The ten states issuing the highest number of multifamily permits combined accounted for 61.1% of the multifamily permits issued. Over the first five months of 2025, Florida, the state with the highest number of multifamily permits issued, experienced an increase of 14.5%. Texas, the second-highest state in multifamily permits, saw an increase of 12.7%. California, the third largest multifamily issuing state, increased by 1.1%. At the local level, below are the top ten metro areas that issued the highest number of single-family permits. For multifamily permits, below are the top ten local areas that issued the highest number of permits. Discover more from Eye On Housing Subscribe to get the latest posts sent to your email.

Permits Falls in May 20252025-07-16T09:16:42-05:00

Permit Activity Weakens in April 2025

2025-06-16T09:15:45-05:00

Housing permits continued a downhill trend for the fourth month in a row, pointing to a broader residential construction slowdown for 2025. Over the first four months of 2025, the total number of single-family permits issued year-to-date (YTD) nationwide reached 320,259. On a year-over-year (YoY) basis, this is a decline of 4.7% over the April 2024 level of 336,124. For multifamily, the total number of permits issued nationwide reached 154,668. This is 1.5% below the April 2024 level of 157,076. Year-to-date ending in April, single-family permits were down in three out of the four regions. The Northeast posted an increase of 5.7%. The Midwest was down by 0.6%, the West was down by 5.6%, and the South was down by 6.1% in single-family permits during this time. For multifamily permits, three out of the four regions posted increases. The Midwest was up by 16.7%, the South was up by 6.2%, and the West was up by 3.7%. Meanwhile, the Northeast declined steeply by 37.7%. Between April 2025 YTD and April 2024 YTD, 18 states posted an increase in single-family permits. The range of increases spanned 27.0% in Hawaii to 0.2% in Maine. The remaining 32 states and the District of Columbia reported declines in single-family permits with New Mexico reporting the steepest decline of 27.5%. The ten states issuing the highest number of single-family permits combined accounted for 63.6% of the total single-family permits issued. Texas, the state with the highest number of single-family permits, issued 52,654 permits over the first four months of 2025; This is a decline of 7.4% compared to the same period last year. The second highest state, Florida, decreased by 9.3%, while the third highest, North Carolina, posted a decline of 1.5%. Between April 2025 YTD and April 2024 YTD, 26 states recorded growth in multifamily permits, while 24 states and the District of Columbia recorded a decline. Alaska (+312.5%) led the way with a sharp rise in multifamily permits from 24 to 99, while New York had the biggest decline of 58.7% from 14,389 to 5,946. The ten states issuing the highest number of multifamily permits combined accounted for 61.1% of the multifamily permits issued. Over the first four months of 2025, Florida, the state with the highest number of multifamily permits issued, experienced an increase of 18.7%. Texas, the second-highest state in multifamily permits, saw an increase of 6.8%. California, the third largest multifamily issuing state, increased by 0.2%. At the local level, below are the top ten metro areas that issued the highest number of single-family permits. For multifamily permits, below are the top ten local areas that issued the highest number of permits. Discover more from Eye On Housing Subscribe to get the latest posts sent to your email.

Permit Activity Weakens in April 20252025-06-16T09:15:45-05:00

Permit Activity Declines in March 2025

2025-05-14T09:17:31-05:00

Permits continue a downhill trend for the third month in a row. Over the first three months of 2025, the total number of single-family permits issued year-to-date (YTD) nationwide reached 232,221. On a year-over-year (YoY) basis, this is a decline of 3.8% over the March 2024 level of 241311. For multifamily, the total number of permits issued nationwide reached 113,344. This is 3.7% below the March 2024 level of 117,695. Year-to-date ending in March, single-family permits were down in three out of the four regions. The Northeast posted an increase of 9.2%. The Midwest was down by 1.9%, the South was down by 4.8%, and the West was down by 5.0% in single-family permits during this time. For multifamily permits, two out of the four regions posted increases. The South was up by 14.6% and the Midwest was up by 12.9%. Meanwhile, the West posted a decline of 13.0% and the Northeast declined steeply by 42.8%. Between March 2025 YTD and March 2024 YTD, 20 states posted an increase in single-family permits. The range of increases spanned 29.6% in Alaska to 0.2% in Utah. The remaining 30 states and the District of Columbia reported declines in single-family permits with New Mexico reporting the steepest decline of 32.7%. The ten states issuing the highest number of single-family permits combined accounted for 64.3% of the total single-family permits issued. Texas, the state with the highest number of single-family permits, issued 38,425 permits over the first three months 2025, which is a decline of 5.5% compared to the same period last year. The second highest state, Florida, was down by 8.8%, while the third highest, North Carolina, posted a decline of 0.1%. Between March 2025 YTD and March 2024 YTD, 23 states and the District of Columbia recorded growth in multifamily permits, while 27 states recorded a decline. Alaska (+533.3%) led the way with a sharp rise in multifamily permits from 12 to 76, while New York had the biggest decline of 64.8% from 11,316 to 3,984. The ten states issuing the highest number of multifamily permits combined accounted for 61.7% of the multifamily permits issued. Over the first three months of 2025, Florida, the state with the highest number of multifamily permits issued, experienced an increase of 48.8%. Texas, the second-highest state in multifamily permits, saw a decline of 0.5%. California, the third largest multifamily issuing state, decreased by 22.7%. At the local level, below are the top ten metro areas that issued the highest number of single-family permits. For multifamily permits, below are the top ten local areas that issued the highest number of permits. Discover more from Eye On Housing Subscribe to get the latest posts sent to your email.

Permit Activity Declines in March 20252025-05-14T09:17:31-05:00

About My Work

Phasellus non ante ac dui sagittis volutpat. Curabitur a quam nisl. Nam est elit, congue et quam id, laoreet consequat erat. Aenean porta placerat efficitur. Vestibulum et dictum massa, ac finibus turpis.

Recent Works

Recent Posts