Podcast: What’s Ahead for New and Existing Housing Markets

2025-10-02T14:16:07-05:00

On the latest episode of NAHB’s podcast, Housing Developments, COO Paul Lopez is joined by NAHB Chief Economist Dr. Robert Dietz and Realtor.com Chief Economist Danielle Hale to delve into the good, the bad and the ugly of today’s housing market.

Podcast: What’s Ahead for New and Existing Housing Markets2025-10-02T14:16:07-05:00

Square Foot Prices Moderate in 2024

2025-10-02T08:19:47-05:00

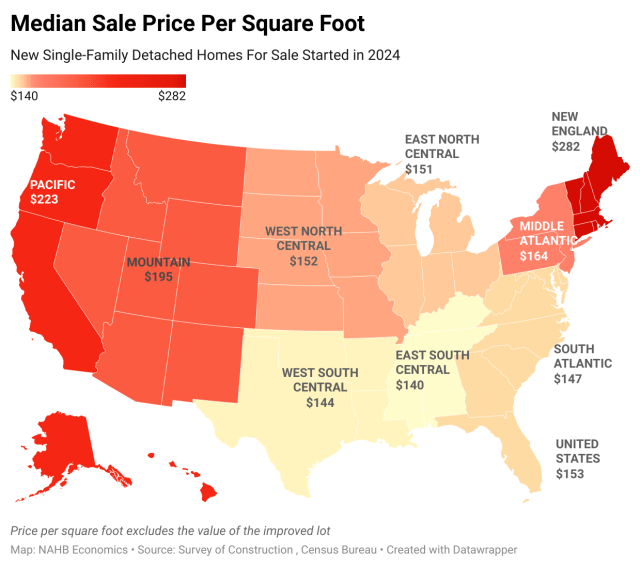
Median square foot prices for new single-family detached (SFD) homes started in 2024 grew modestly, according to NAHB’s analysis of the latest Survey of Construction (SOC) data. For custom, or contractor-built, homes, the median price was $166 per square foot of floor space1, up slightly from $162 in 2023. For spec starts, after excluding record-high improved lot values, the median was $153 per square foot of floor area, inching up from $150 a year earlier. There is still notable regional variation in square footage prices. In New England, after excluding lot values, half of the spec homes started in 2024 had prices exceeding $282 per square foot. In the East South Central division, the median was $133, representing the most affordable prices per square foot.Contract prices of custom homes do not include the value of an improved lot, as these homes are built on the owner’s land (with either the owner or a contractor acting as a general contractor). Consequently, contract prices are typically reported as lower than the sale prices of spec homes. To make the comparison more meaningful, the cost of lot development is excluded from sale prices in this analysis. The recent modest square foot price changes marked a sharp decline from the double-digit price hikes that characterized home building in the post-pandemic environment. As recently as 2022, increases in square foot prices of new SFD homes were approaching 20%, more than doubling the historically high U.S. inflation rate of 8%. The deceleration for median square foot prices reflects slower growth in building material prices and home building wages in 2024. The shifts towards cost-effective methods, such as building homes on slabs rather than with full or partial basements, also contributed to moderating the increases in square foot prices.In the for-sale market, the New England division registered the highest and fastest-rising median square foot prices. Half of the new for-sale SFD homes started here in 2024 were sold at prices exceeding $282 per square foot of floor area, paid on top of some of the most expensive lot values in the nation. The Pacific division came in second, with median prices of $223 per square foot. The most economical SFD spec homes were started in the South region, where the median sales price per square foot was below the national median of $153. The East South Central division is home to the least expensive for-sale homes. Half of all for-sale SFD homes started in the division in 2024 registered a square foot price of $140 or lower, paid on top of the most economical lot values in the country. The other two divisions in the South— South Central and South Atlantic—registered median prices of $144 and $147 per square foot, ranking them the second- and third-lowest medians in the nation. Because square foot prices in this analysis exclude the cost of developed lots, highly variable land values cannot account for regional differences in square footage prices. However, overly restrictive zoning, stricter building codes, and higher regulatory costs undoubtedly lead to higher per-square-foot prices. Regional differences in home types, common features, and construction materials also contribute to price variations. In the South, for example, lower square foot prices partially reflect a less frequent regional occurrence of costly new home features like basements. In the custom home market, new contractor-built SFD homes in the Northeast were more expensive to build. Half of custom SFD homes started in New England in 2024 registered prices greater than $190 per square foot of floor area. In the neighboring Middle Atlantic, the median custom home price was similarly high at $188 per square foot. The East North Central division came in close third, with a median of $186 per square foot of floor space. The East South Central and West South Central divisions are home to the most economical custom homes started in 2024, with half of the new custom homes registering prices at or below $129 and $138 per square foot of floor space, respectively. The remaining division in the South region — South Atlantic — recorded slightly higher median square foot contract prices of $155, still below the national median of $166. In the West, the Mountain division registered noticeable declines in square foot prices over the last two years, erasing a substantial portion of the post-pandemic double-digit annual hikes. Half of the custom SFD homes started here in 2024 had prices of $169 per square foot or higher. The corresponding median price in the neighboring Pacific was $167 per square foot. In comparison, during the post-pandemic home building boom, the median crossed the $200 mark for homes started in 2022 in the Mountain Division. Typically, when excluding improved lot values, contractor-built custom homes are more expensive per square foot than for-sale homes. Over the last two decades, this custom home premium averaged slightly above 9%, suggesting that new custom home buyers are not only willing to wait longer to move into a new home but also pay extra for pricier features and materials. However, these custom home premiums (see the chart below) largely disappeared in the post-pandemic environment marked by supply chain disruptions, soaring building materials costs, and home prices hitting new highs each month. In the last two years, the custom home premium returned to historic norms, indicating that the post-pandemic trend has reversed, and custom home buyers are once again willing to pay more for higher-end features and materials. The NAHB estimates in this post are based on the Survey of Construction (SOC) data. The survey information comes from interviews with builders and owners of the selected new houses. The reported prices are medians, meaning that half of all builders reported higher square foot prices, and the other half reported prices lower than the median. While the reported median prices cannot reflect the price variability within a division, and even less so within a metro area, they, nevertheless, highlight the regional differences in square foot prices. For the square footage statistics, the SOC uses all completely finished floor space, including space in basements and attics with finished walls, floors, and ceilings. This does not include a garage, carport, porch, unfinished attic, utility room, or any unfinished area of the basement. Discover more from Eye On Housing Subscribe to get the latest posts sent to your email.

Square Foot Prices Moderate in 20242025-10-02T08:19:47-05:00

17% of NAHB Builders Built Age-Restricted Housing in 2024

2025-10-02T08:19:50-05:00

Only 17% of NAHB builder members build age-restricted housing for people age 55 or older, according to 2024 Member Census.  This is up two percentage points from the previous year.  However, this share has remained within a narrow band (15%-17%) since the question was added to the member census in 2009.  The likelihood of building age-restricted housing generally increases with the size of the company.  Among builders with 25 or fewer starts in 2024, only 16% to 17% build this type of housing, compared to 36% among those with 100+ starts.  Across business activities, multifamily builders are significantly more likely to build for the 55+ population (44%) than single-family builders (19%) or manufacturers of modular/panelized/log homes (32%). The median age of the U.S. population continues to increase, inching closer to 40.  With more than 30% of the U.S. population over the age of 55,  this growing demographic group will remain a significant segment of the market for years to come. In 2024, 43,000 housing units were started in age-restricted communities, but this is down 16% from the previous year.  For the existing housing stock, aging-in-place remodeling work is a way to satisfy the demands of an older population looking to remain in their homes longer. For more details about NAHB builder members, please visit housingeconomics.com or click here for the full article. Discover more from Eye On Housing Subscribe to get the latest posts sent to your email.

17% of NAHB Builders Built Age-Restricted Housing in 20242025-10-02T08:19:50-05:00

Consumer Confidence Drops on Job Concerns

2025-10-01T08:24:16-05:00

Consumer confidence fell to a five-month low as consumers remain concerned about reignited inflation and a weakening labor market amid economic uncertainty. The labor market differential, which measures the gap between consumers viewing job as plentiful and hard-to-get, has narrowed for nine straight month and is now at lowest level since March 2021. This is consistent with recent job reports showing fewer job openings and slower hiring. The Consumer Confidence Index, reported by the Conference Board, is a survey measuring how optimistic or pessimistic consumers feel about their financial situation. This index fell from 97.8 to 94.2 in September, the lowest level since April. The Consumer Confidence Index consists of two components: how consumers feel about their present situation and their expected situation. In September, the Present Situation Index decreased 7.0 points from 132.4 to 125.4, the largest monthly decline since September 2024; the Expectation Situation Index dropped 1.3 points from 74.7 to 73.4. This is the eighth consecutive month that the Expectation Index has been below 80, a threshold that often signals a recession within a year. Consumers’ assessment of current business conditions deteriorated in September. The share of respondents rating business conditions “good” decreased by 2.3 percentage points to 19.5%, while those claiming business conditions as “bad” rose by 0.8 percentage points to 15.4%. Meanwhile, consumers’ assessments of the labor market cooled further in September. The share of respondents reporting that jobs were “plentiful” fell by 3.3 percentage points at 26.9%, the lowest level since March 2021; meanwhile, those who saw jobs as “hard to get” stayed unchanged at 19.1%. Consumers were more pessimistic about the short-term outlook. The share of respondents expecting business conditions to improve fell from 20.2% to 18.7%, while those expecting business conditions to deteriorate declined from 23.5% to 22.3%. Similarly, expectations of employment over the next six months were more negative. The share of respondents expecting “more jobs” decreased by 1.8 percentage points to 16.1%, and those anticipating “fewer jobs” fell by 0.3 percentage points to 25.6%. Discover more from Eye On Housing Subscribe to get the latest posts sent to your email.

Consumer Confidence Drops on Job Concerns2025-10-01T08:24:16-05:00

How the Government Shutdown Will Affect Housing

2025-10-01T07:16:48-05:00

The White House and Republican and Democratic congressional leaders failed to reach an agreement to extend government funding on Tuesday, resulting in a shutdown of most federal government functions at 12:01 a.m. on Wednesday, Oct. 1 that will affect housing and home builders.

How the Government Shutdown Will Affect Housing2025-10-01T07:16:48-05:00

About My Work

Phasellus non ante ac dui sagittis volutpat. Curabitur a quam nisl. Nam est elit, congue et quam id, laoreet consequat erat. Aenean porta placerat efficitur. Vestibulum et dictum massa, ac finibus turpis.

Recent Works

Recent Posts