June Private Residential Construction Spending Edges Higher
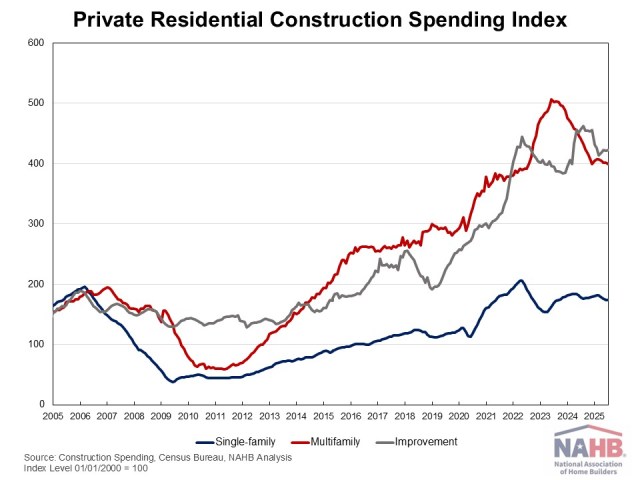
Na Zhao2025-09-02T11:15:45-05:00Private residential construction spending inched up 0.1% in June, registering the first monthly gain after six consecutive declines. This modest increase was primarily driven by more spending on single-family construction and home improvements. Despite this increase, total spending was 5.3% lower than a year ago, as the housing sector continues to navigate the economic uncertainty stemming from ongoing tariff concerns and elevated mortgage rates. According to the latest U.S. Census Construction Spending data, single-family construction spending edged up 0.1% in June, in line with the slight improvement reflected in the July NAHB/Wells Fargo Housing Market Index (HMI). Compared to a year ago, single-family construction spending decreased by 2.1%. Improvement spending (remodeling) was up 0.1% for the month but remained 7.6% lower than in June 2024. Meanwhile, multifamily construction spending slipped 0.4% in June, continuing the downward trend that began in mid-2023. Compared to a year earlier, multifamily spending was down 9.4%. The NAHB construction spending index is shown in the graph below. The index illustrates how spending on single-family construction has slowed since early 2024 under the pressure of elevated interest rates and concerns over building material tariffs. Multifamily construction spending growth has also slowed down after the peak in July 2023. Improvement spending has also been weakening since the beginning of 2025. Spending on private nonresidential construction was down 3.7% over a year ago. The annual private nonresidential spending decrease was primarily driven by a $16 billion drop in commercial construction spending, followed by a $12.2 billion decrease in commercial construction spending. Discover more from Eye On Housing Subscribe to get the latest posts sent to your email.