Single-Family Housing Starts Hit 12-Month High in February
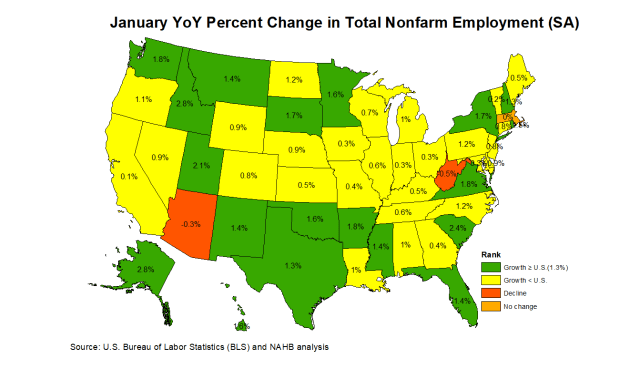
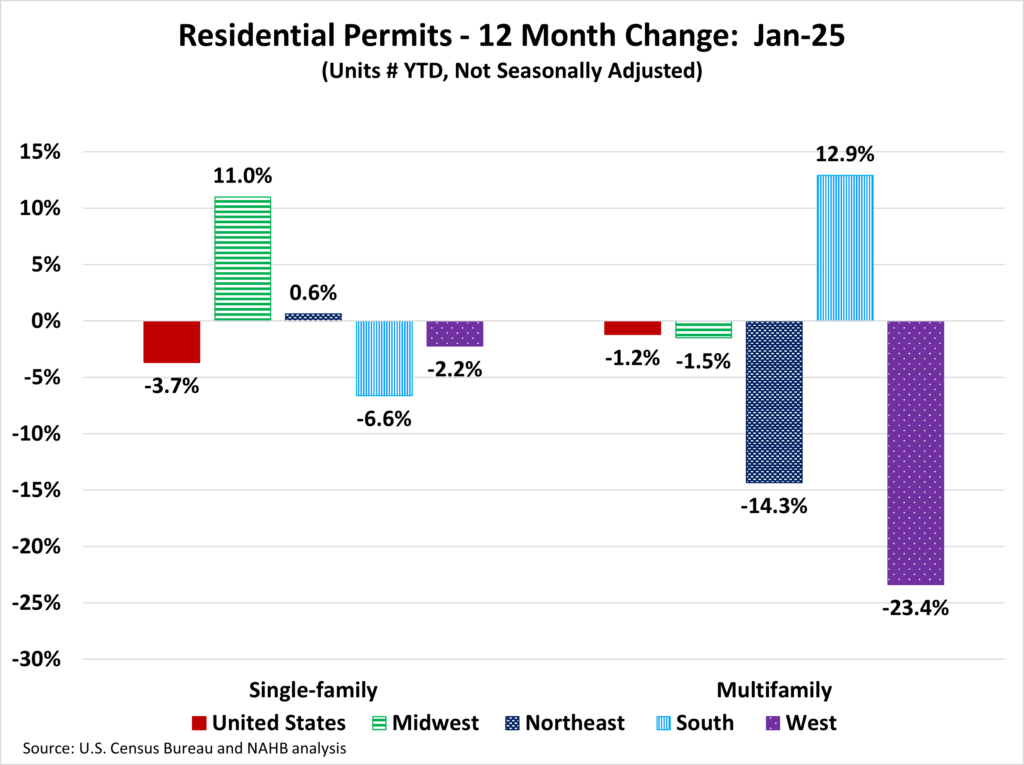
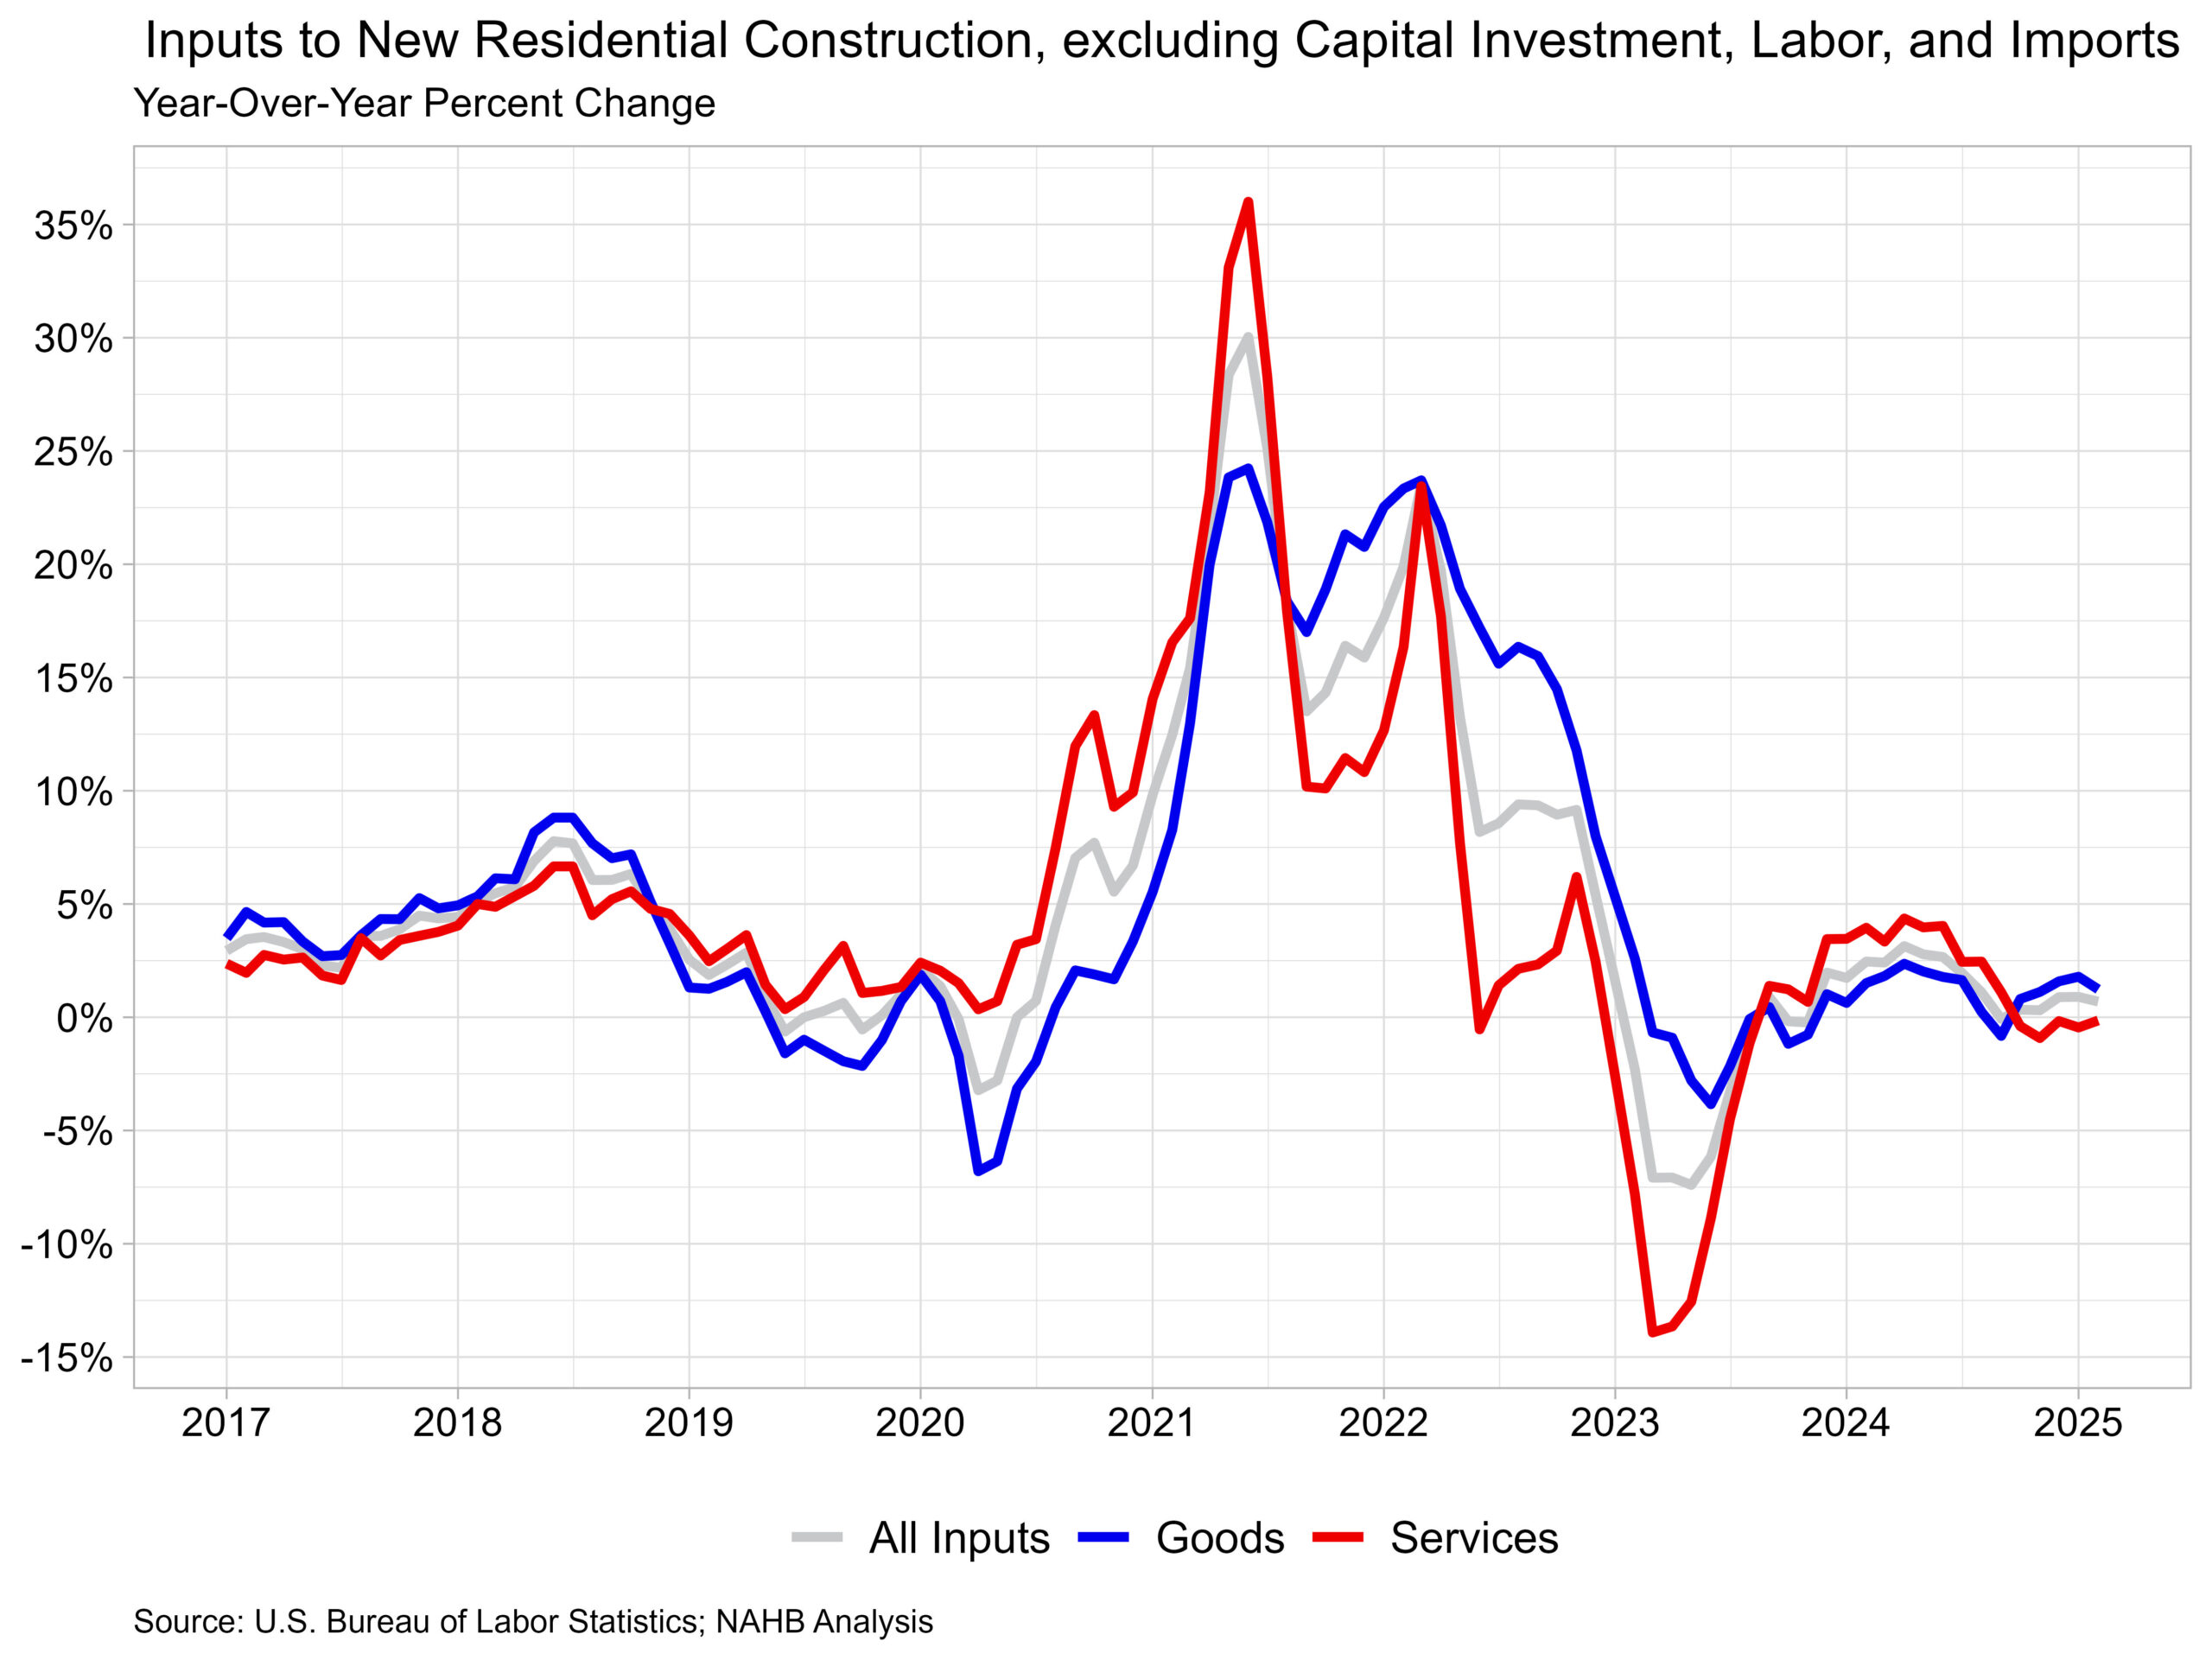
Jing Fu2025-03-18T10:19:07-05:00Limited existing inventory helped single-family starts to post a solid gain in February, but builders are still grappling with elevated construction costs stemming from tariff issues and persistent shortages related to buildable lots and labor. Overall housing starts increased 11.2% in February to a seasonally adjusted annual rate of 1.50 million units, according to a report from the U.S. Department of Housing and Urban Development and the U.S. Census Bureau. The February reading of 1.50 million starts is the number of housing units builders would begin if development kept this pace for the next 12 months. Within this overall number, single-family starts increased 11.4% to a 1.11 million seasonally adjusted annual rate, the highest pace since February 2024. The multifamily sector, which includes apartment buildings and condos, increased 10.7% to an annualized 393,000 pace. While solid demand and a lack of existing inventory provided a boost to single-family production in February, our latest builder survey shows that builders remain concerned about challenging housing affordability conditions, most notably elevated financing and construction costs as well as tariffs on key building materials. On a regional and year-to-date basis, combined single-family and multifamily starts were 4.7% lower in the Northeast, 21.5% lower in the Midwest, 8.3% lower in the South and 20.2% higher in the West. Overall permits decreased 1.2% to a 1.46-million-unit annualized rate in February and were down 6.8% compared to February 2024. Single-family permits decreased 0.2% to a 992,000-unit rate and were down 3.4% compared to the previous year. Multifamily permits decreased 3.1% to a 464,000 pace. Looking at regional permit data on a year-to-date basis, permits were 30.1% lower in the Northeast, 2.3% higher in the Midwest, 2.1% lower in the South and 12.5% lower in the West. The number of single-family homes under construction in February was down 6.7% from a year ago, at 640,000 homes. In February, the count of apartments under construction increased 0.3% to an annualized 772,000 pace. It marks the first gain after 18 months of consecutive declines but was still down 20% from a year ago. There were 526,000 multifamily completions in February, down 15% from the previous year. For each apartment starting construction, there are 1.5 apartments completing the construction process. Discover more from Eye On Housing Subscribe to get the latest posts sent to your email.