New Home Sales Rise in March
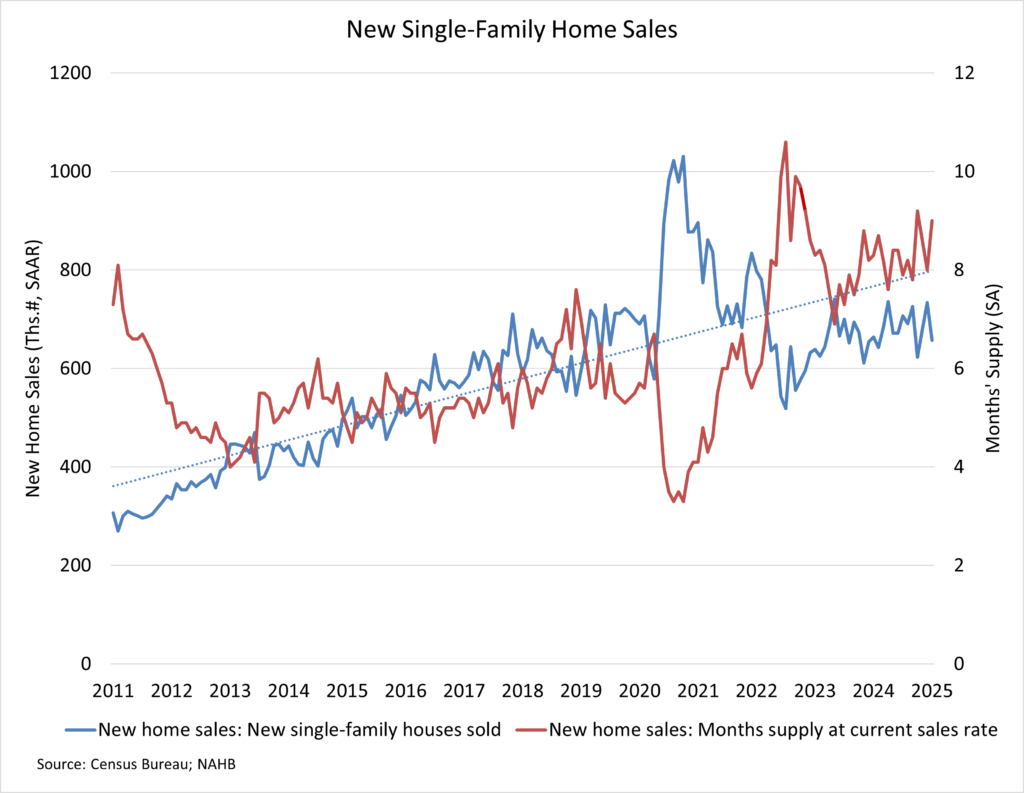
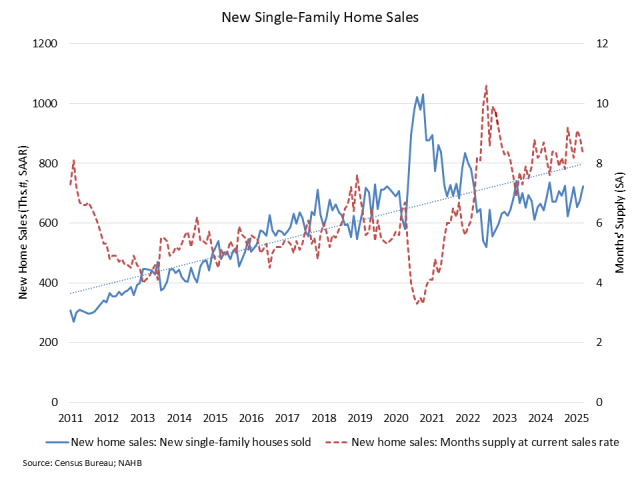
Robert Dietz2025-04-23T10:33:44-05:00A modest decline in mortgage rates and lean existing inventory helped boost new home sales in March even as builders and consumers contend with uncertain market conditions. Sales of newly built, single-family homes in March increased 7.4% to a 724,000 seasonally adjusted annual rate from a revised January number, according to newly released data from the U.S. Department of Housing and Urban Development and the U.S. Census Bureau. The pace of new home sales in March was up 6.0% compared to a year earlier. The March new home sales data shows that demand continues to be present in the market, provided affordability conditions permit a purchase. An increase in economic certainty would be a big boost to future sales conditions. Lower mortgage interest rates helped boost the pace of new home sales in March. In February, the average 30-year fixed rate mortgage was 6.84%, while in March it fell to 6.65%. A new home sale occurs when a sales contract is signed, or a deposit is accepted. The home can be in any stage of construction: not yet started, under construction or completed. In addition to adjusting for seasonal effects, the March reading of 724,000 units is the number of homes that would sell if this pace continued for the next 12 months. New single-family home inventory in March continued to rise to a level of 503,000, up 7.9% compared to a year earlier. This represents an 8.3 months’ supply at the current building pace. This level of supply continues to be reasonable given that the resale, single-family months’ supply remains lean at just 3.4. The count of completed, ready-to-occupy homes available for sale increased to 119,000, up 34% from a year ago. However, the March data also is showing signs that the total amount of inventory in the new construction space has slowed given soft housing conditions at the start of 2025. For example, the count of new homes available for sale that are under construction (263,000 in March) is down 5% year-over-year and 6% lower than the non-seasonally adjusted peak count set in October 2024. The median new home sale price in March was $403,600, down 7.5% from a year ago. Sales were particularly strong at lower price levels. Compared to March 2024, new homes sales were 33% higher for homes priced below $300,000 and 28% higher for new homes priced between $300,000 and $400,000. Regionally, on a year-to-date basis, new home sales are up 12.9% in the South, but are down 32% in the Northeast, 18.3% in the Midwest and 6% in the West. Discover more from Eye On Housing Subscribe to get the latest posts sent to your email.