State-Level Employment Situation: March 2025
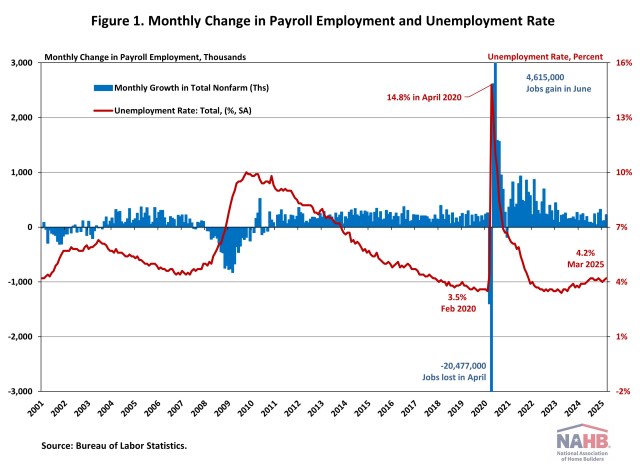
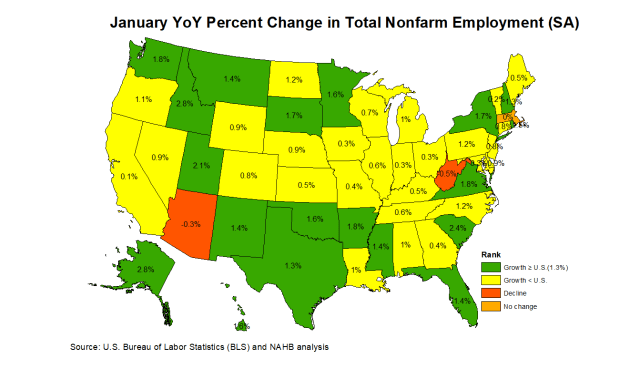
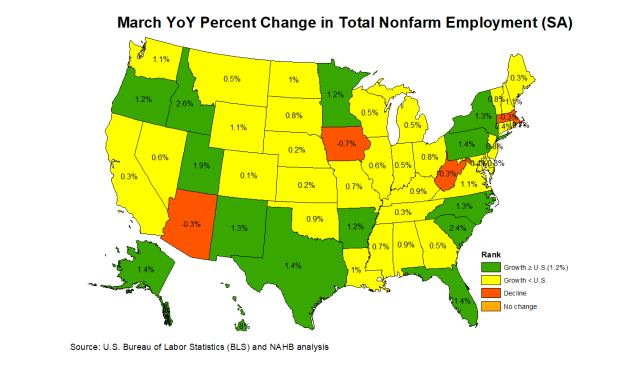
Danushka Nanayakkara-Skillington2025-04-18T12:20:32-05:00Nonfarm payroll employment increased in 37 states and the District of Columbia in March compared to the previous month, while it decreased in 12 states. Wyoming reported no change during this time. According to the Bureau of Labor Statistics, nationwide total nonfarm payroll employment increased by 228,000 in March following a gain of 117,000 jobs in February. On a month-over-month basis, employment data was most favorable in Texas, which added 26,500 jobs. Pennsylvania came in second (+20,900), followed by Florida (+18,100). Meanwhile, a total of 33,900 jobs were lost across 12 states, with California reporting the steepest job losses at 11,600. In percentage terms, employment increased the highest in Missouri at 0.5%, while Connecticut saw the biggest decline at 0.3% between February and March. Year-over-year ending in March, 1.9 million jobs have been added to the labor market, which is a 1.2% increase compared to the March 2024 level. The range of job gains spanned from 300 jobs in the District of Columbia to 192,100 jobs in Texas. Four states lost a total of 34,700 jobs in the past 12 months, with Iowa reporting the steepest job losses at 11,800. In percentage terms, the range of job growth spanned 2.6% in Idaho to 0.1% in Colorado. The District of Columbia was unchanged while West Virginia, Massachusetts, Arizona, and Iowa declined by 0.3%, 0.3%, 0.3%, and 0.7% respectively. Construction Employment Across the nation, construction sector jobs data 1—which includes both residential and non-residential construction—showed that 30 states reported an increase in March compared to February, while 17 states and the District of Columbia lost construction sector jobs. The three remaining states reported no change on a month-over-month basis. Texas, with the highest increase, added 8,500 construction jobs, while California, on the other end of the spectrum, lost 3,700 jobs. Overall, the construction industry added a net 13,000 jobs in March compared to the previous month. In percentage terms, Kentucky reported the highest increase at 3.6% and Mississippi reported the largest decline at 3.4%. Year-over-year, construction sector jobs in the U.S. increased by 143,000, which is a 1.8% increase compared to the March 2024 level. Texas added 28,700 jobs, which was the largest gain of any state, while California lost 23,400 construction sector jobs. In percentage terms, New Mexico had the highest annual growth rate in the construction sector at 12.0%. Over this period, Washington reported the largest decline of 5.3%. For this analysis, BLS combined employment totals for mining, logging, and construction are treated as construction employment for the District of Columbia, Delaware, and Hawaii. Discover more from Eye On Housing Subscribe to get the latest posts sent to your email.