Permits Pullback in February 2025
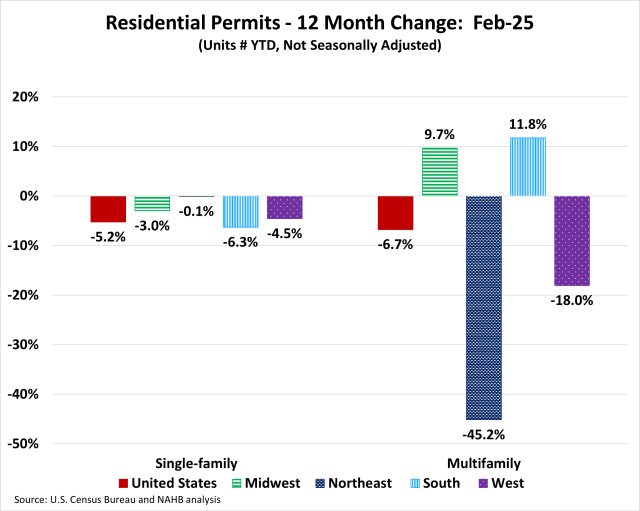
Danushka Nanayakkara-Skillington2025-04-15T09:19:44-05:00Permits continue the downward trend for the second month in a row. Over the first two months of 2025, the total number of single-family permits issued year-to-date (YTD) nationwide reached 147,119. On a year-over-year (YoY) basis, this is a decline of 5.2% over the February 2024 level of 155,236. For multifamily, the total number of permits issued nationwide reached 72,979. This is 6.7% below the February 2024 level of 78,259. Year-to-date ending in February, single-family permits were down in all four regions. The Northeast posted the smallest decline of 0.1%, the Midwest was down by 3.0%, the West was down by 4.5% and the South was down by 6.3% in single-family permits during this time. For multifamily permits, two out of the four regions posted increases. The South was up by 11.8% and the Midwest was up by 9.7%. Meanwhile, the West posted a decline of 18.0% and the Northeast declined steeply by 45.2%. Between February 2025 YTD and February 2024 YTD, 19 states and the District of Columbia posted an increase in single-family permits. The range of increases spanned 133.3% in the District of Columbia to 0.1% in New Jersey. The remaining 31 states reported declines in single-family permits with West Virginia reporting the steepest decline of 21.1%. The ten states issuing the highest number of single-family permits combined accounted for 65.6% of the total single-family permits issued. Texas, the state with the highest number of single-family permits, issued 24,960 permits over the first two months 2025, which is a decline of 5.6% compared to the same period last year. The second highest state, Florida, was down by 8.3%, while the third highest, North Carolina, posted a decline of 4.5%. Between February 2025 YTD and February 2024 YTD, 26 states and the District of Columbia recorded growth in multifamily permits, while 24 states recorded a decline. Iowa (+177.4%) led the way with a sharp rise in multifamily permits from 354 to 982, while Arizona had the biggest decline of 67.5% from 3,209 to 1,044. The ten states issuing the highest number of multifamily permits combined accounted for 63.2% of the multifamily permits issued. Over the first two months of 2025, Florida, the state with the highest number of multifamily permits issued, experienced an increase of 63.0%. Texas, the second-highest state in multifamily permits, saw a decline of 9.0%. California, the third largest multifamily issuing state, decreased by 21.7%. At the local level, below are the top ten metro areas that issued the highest number of single-family permits. For multifamily permits, below are the top ten local areas that issued the highest number of permits. Discover more from Eye On Housing Subscribe to get the latest posts sent to your email.