Real Estate Asset Value Falls Again

2025-03-14T10:18:17-05:00

The market value of household real estate assets fell from $48.5 trillion to $48.1 trillion in the fourth quarter of 2024, according to the most recent release of U.S. Federal Reserve Z.1 Financial Accounts. Household real estate assets value have fallen for two consecutive quarters after peaking at $48.7 trillion in the second quarter of 2024. However, household real estate assets were 7.0% higher over the year in the fourth quarter following a 7.1% increase in the third quarter. Real estate secured liabilities of households’ balance sheets, i.e. mortgages, home equity loans, and HELOCs, increased 0.8% over the fourth quarter to $13.3 trillion. This level is 2.6% higher compared to the fourth quarter of 2023, the same year-over-year increase as the third quarter. Owners’ equity share of real estate assets 1 remained above 72% for the fourth straight quarter. The share in the fourth quarter of 2024 was 72.2%, down from a peak of 73.0% just two quarters ago. Owners’ equity as a percentage of household real estate; Difference between assets and liabilities as a share of assets Discover more from Eye On Housing Subscribe to get the latest posts sent to your email.

Real Estate Asset Value Falls Again2025-03-14T10:18:17-05:00

Softwood Lumber Prices Continue to Lead Price Growth for Building Materials

2025-03-13T11:20:23-05:00

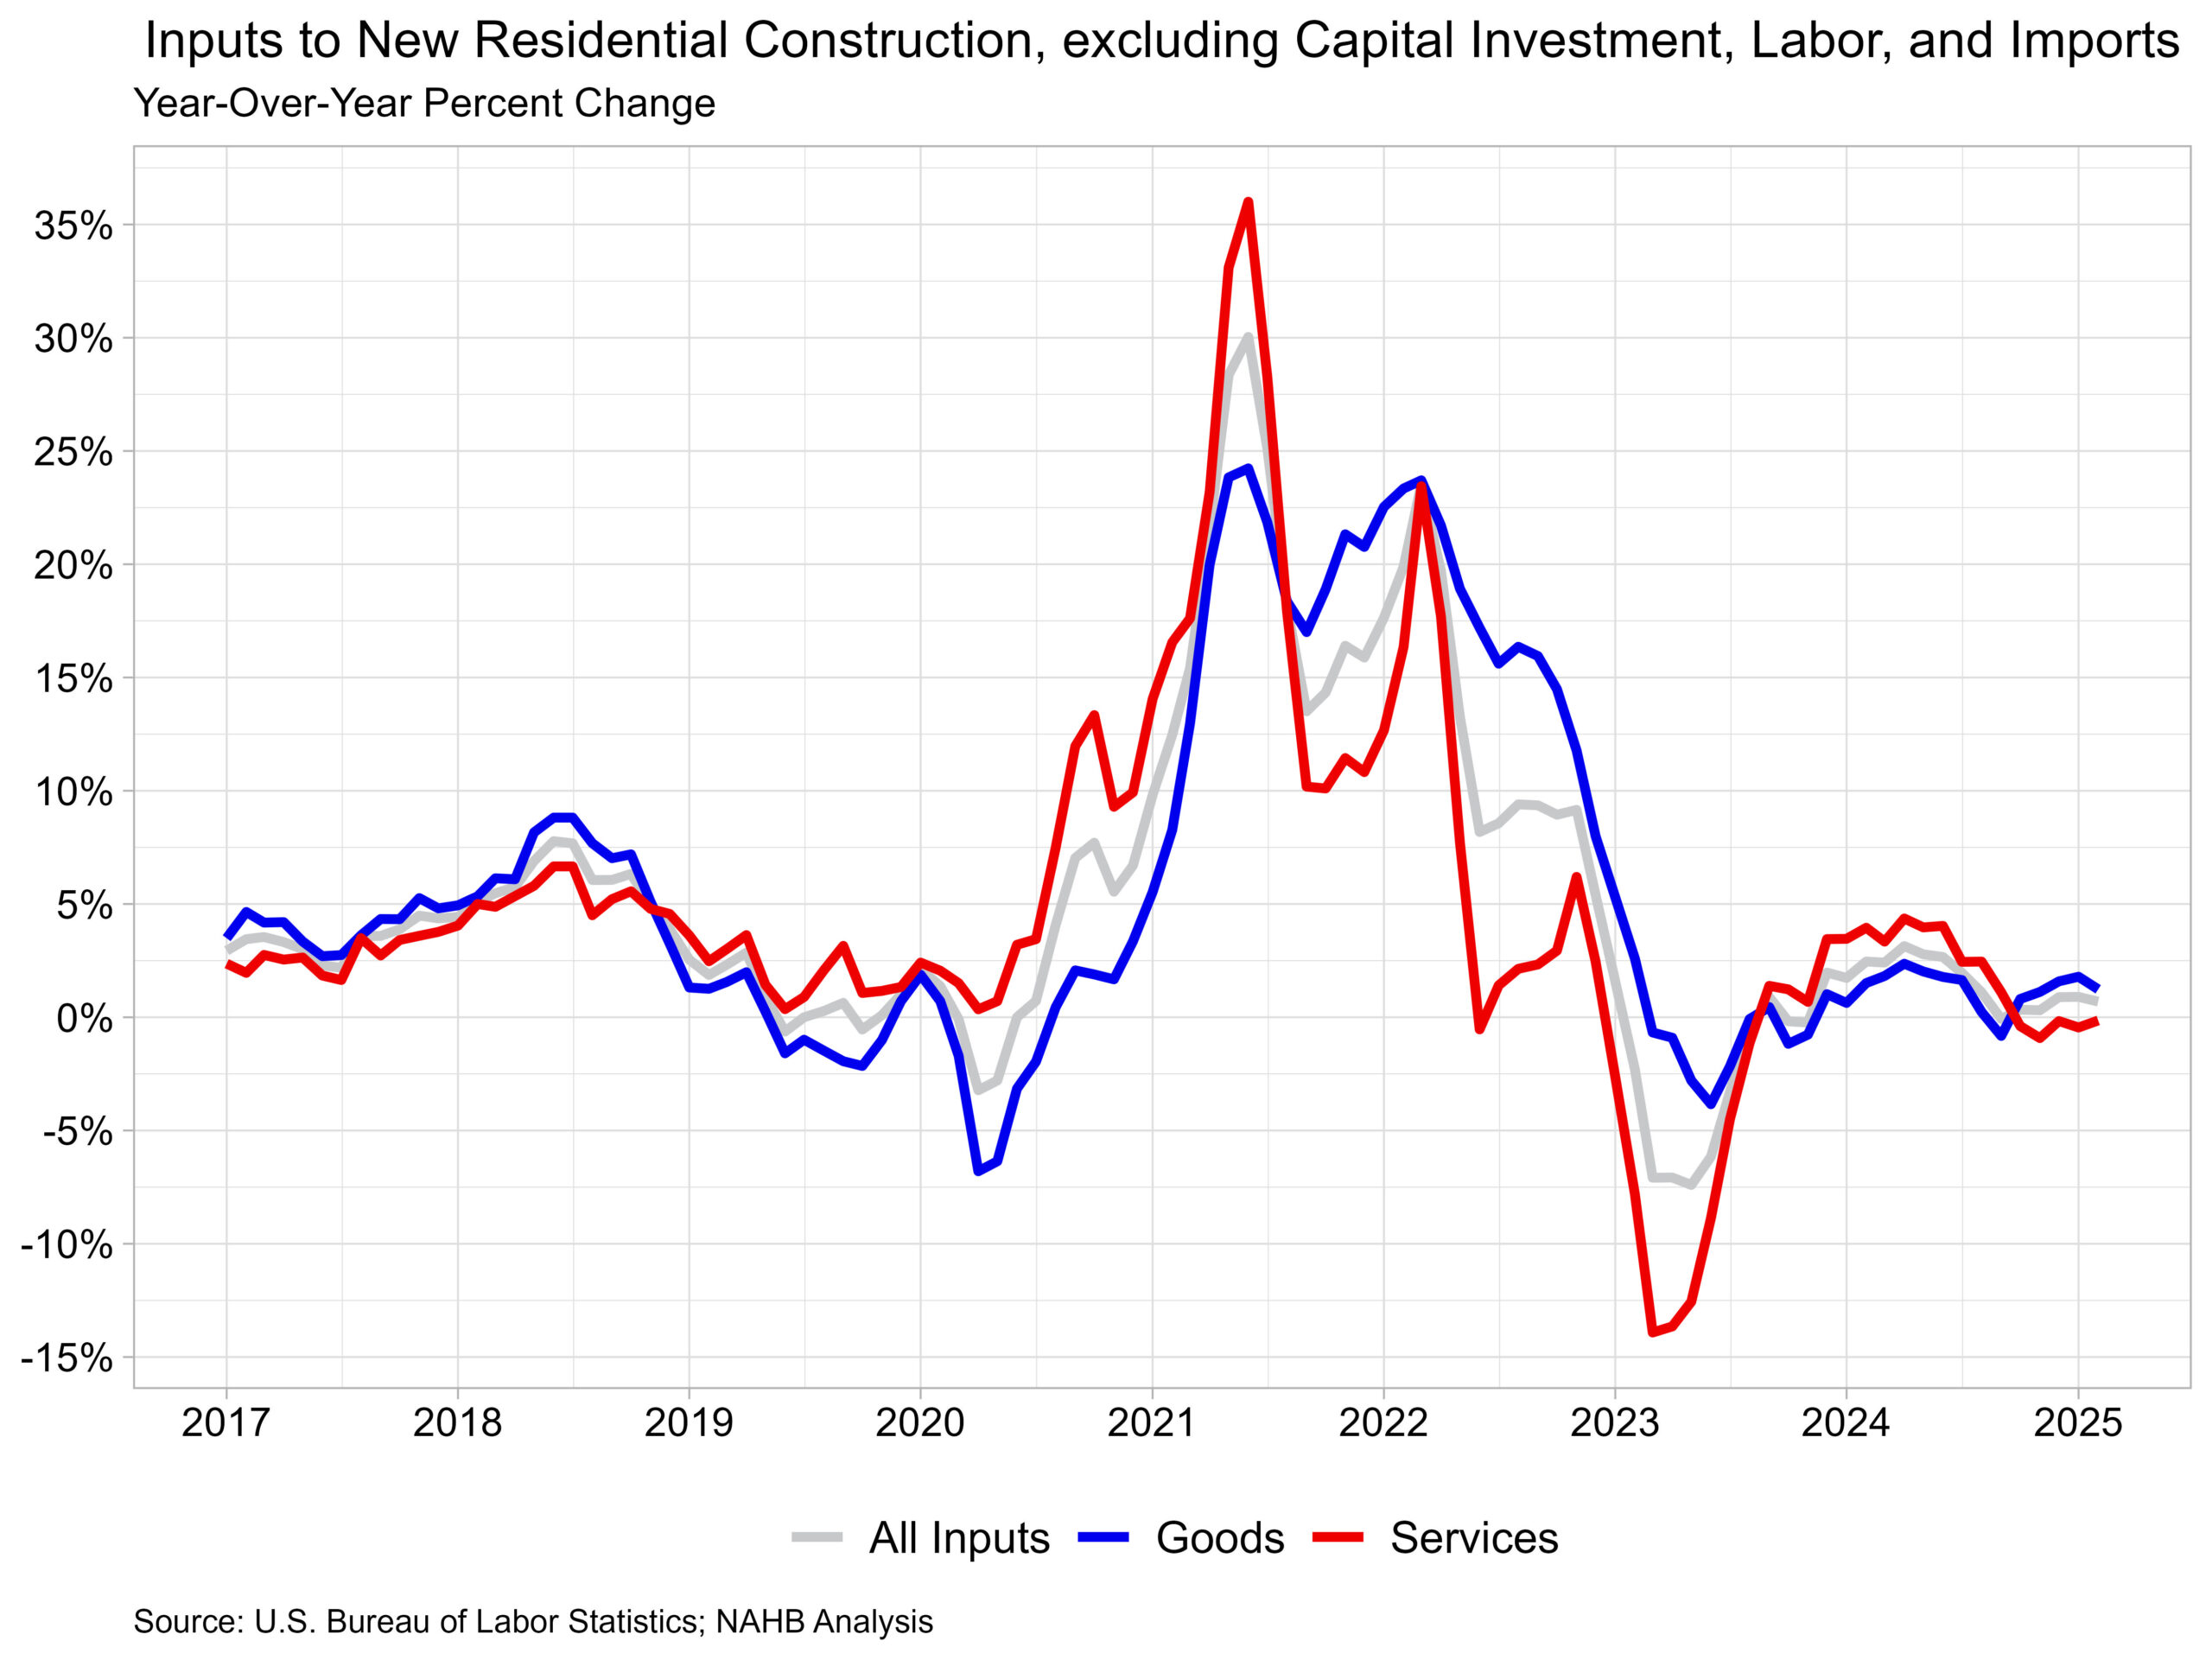
Prices for inputs to new residential construction—excluding capital investment, labor, and imports—were up 0.5% in February according to the most recent Producer Price Index (PPI) report published by the U.S. Bureau of Labor Statistics. The increase in January was revised downward to 1.1%. The Producer Price Index measures prices that domestic producers receive for their goods and services, this differs from the Consumer Price Index which measures what consumers pay and includes both domestic products as well as imports. The inputs to the New Residential Construction Price Index grew 0.7% from February of last year. The index can be broken into two components—the goods component increased 1.2% over the year, while services decreased 0.1%. For comparison, the total final demand index, which measures all goods and services across the economy, increased 3.2% over the year, with final demand with respect to goods up 1.7% and final demand for services up 3.9% over the year. Input Goods The goods component has a larger importance to the total residential construction inputs price index, representing around 60%. For the month, the price of input goods to new residential construction was up 0.6% in February. The input goods to residential construction index can be further broken down into two separate components, one measuring energy inputs with the other measuring goods less energy inputs. The latter of these two components simply represents building materials used in residential construction, which makes up around 93% of the goods index. Energy input prices grew 2.6% between January and February but remained 8.5% lower compared to one year ago. Building material prices were up 0.5% between January and February while they were up 2.0% compared to one year ago. Among materials used in residential construction, lumber and wood products ranks 3rd in terms of importance for the Inputs to New Residential Construction Index. Nonmetallic mineral products and metal products rank 1st and 2nd, respectively. The top lumber and wood products include general millwork, prefabricated structural members, not-edge worked softwood lumber, softwood veneer/plywood and hardwood veneer/plywood. Prices for these wood commodities experienced little growth for most of 2024. Currently, softwood lumber prices were 11.7% higher compared to one year ago while on a monthly basis, prices rose 3.0%. This marks the fourth straight month where yearly price growth was above 10% for softwood lumber. Input Services While prices of inputs to residential construction for services were down 0.1% over the year, they were up 0.4% in February from January. The price index for service inputs to residential construction can be broken out into three separate components: a trade services component, a transportation and warehousing services component, and a services excluding trade, transportation and warehousing component. The most significant component is trade services (around 60%), followed by services less trade, transportation and warehousing (around 29%), and finally transportation and warehousing services (around 11%). The largest component, trade services, was down 1.5% from a year ago. The services less trade, transportation and warehousing component was up 1.6% over the year.  Lastly, prices for transportation and warehousing services advanced 2.2% compared to February last year. Discover more from Eye On Housing Subscribe to get the latest posts sent to your email.
Softwood Lumber Prices Continue to Lead Price Growth for Building Materials2025-03-13T11:20:23-05:00

Inflation Eased Ahead of Tariffs

2025-03-12T10:20:03-05:00

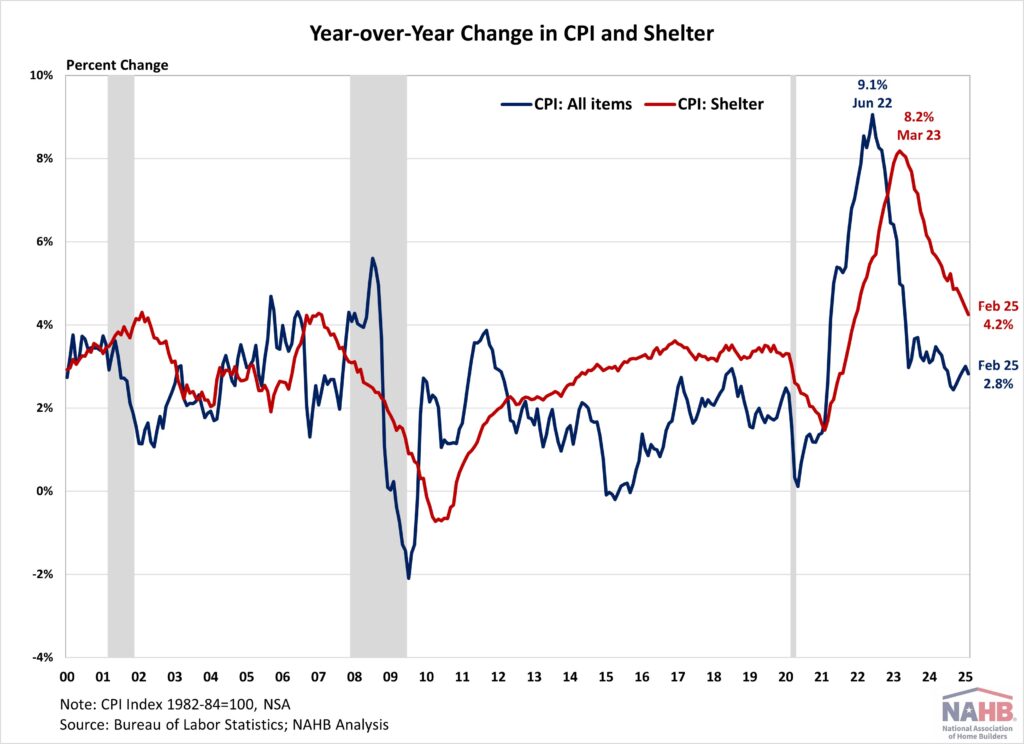
Inflation slowed to a 3-month low in February, with decreases in airfares and gasoline partially offsetting shelter increases. Despite the easing, the report does not capture upcoming tariff impacts. The inflationary pressure from tariffs and trade war would weigh on the economy and complicate the Fed’s path to its 2% target. Meanwhile, while housing drove nearly half of February’s inflation increase and remains higher than the 2019 pre-pandemic average of 3.4%, it continues to show signs of cooling – the year-over-year change in the shelter index remained below 5% for a sixth straight month and posted its lowest annual gain since December 2021.  While the Fed’s interest rate cuts could help ease some pressure on the housing market, its ability to address rising housing costs is limited, as these increases are driven by a lack of affordable supply and increasing development costs. In fact, tight monetary policy hurts housing supply because it increases the cost of AD&C financing. This can be seen on the graph below, as shelter costs continue to rise at an elevated pace despite Fed policy tightening. Additional housing supply is the primary solution to tame housing inflation and with it, overall inflation. This emphasizes why the cost of construction, including the cost of building materials, matters not just for housing but also the inflation outlook and the path of future monetary policy. Consequently, the election result has put inflation back in the spotlight and added additional upside and downside risks to the economic outlook. Proposed tax cuts and tariffs could increase inflationary pressures, suggesting a more gradual easing cycle with a slightly higher terminal federal funds rate. However, economic growth could also be higher with lower regulatory burdens. Given the housing market’s sensitivity to interest rates, a higher inflation path could extend the affordability crisis and constrain housing supply as builders continue to grapple with lingering supply chain challenges. During the past twelve months, on a non-seasonally adjusted basis, the Consumer Price Index rose by 2.8% in February, according to the Bureau of Labor Statistics’ report. This followed a 3.0% year-over-year increase in January. Excluding the volatile food and energy components, the “core” CPI increased by 3.1% over the past twelve months, marking the first notable decline after hovering between 3.2% and 3.3% since June 2024. A large portion of the “core” CPI is the housing shelter index, which increased 4.2% over the year, the smallest year-over-year increase since December 2021.  Meanwhile, the component index of food rose by 2.6%, and the energy component index fell by 0.2%. On a monthly basis, the CPI rose by 0.2% in February (seasonally-adjusted), after a 0.5% increase in January. The “core” CPI increased by 0.2% in February. The price index for a broad set of energy sources rose by 0.2% in February, with declines in gasoline (-1.0%) offset by increases in electricity (+1.0%), natural gas (+2.5%) and fuel oil (+0.8%). Meanwhile, the food index rose 0.2%, after a 0.4% increase in January. The index for food away from home increased by 0.4% and the index for food at home remained unchanged. The index for shelter (+0.3%) was the largest contributor to the monthly increase in all items index, accounting for nearly half of the total increase. Other top contributors that rose in February include indexes for medical care (+0.3%), used cars and trucks (+0.9%), household furnishings and operations (+0.4%), as well as recreation (+0.3%). Meanwhile, the index for airline fares (-4.0%) and new vehicles (-0.1%) were among the few major indexes that decreased over the month. The index for shelter makes up more than 40% of the “core” CPI, rose by 0.3% in February, following an increase of 0.4% in January. Both indexes for owners’ equivalent rent (OER) and rent of primary residence (RPR) increased by 0.3% over the month. Despite the moderation, shelter costs remained the largest contributors to headline inflation.  NAHB constructs a “real” rent index to indicate whether inflation in rents is faster or slower than core inflation. It provides insight into the supply and demand conditions for rental housing. When inflation in rents is rising faster than core inflation, the real rent index rises and vice versa. The real rent index is calculated by dividing the price index for rent by the core CPI (to exclude the volatile food and energy components). In January, the Real Rent Index rose by 0.1%. Over the first two months of 2025, the monthly growth rate of the Real Rent Index averaged remained flat at 0.0%, unchanged from the same period in 2024. Discover more from Eye On Housing Subscribe to get the latest posts sent to your email.
Inflation Eased Ahead of Tariffs2025-03-12T10:20:03-05:00

Residential Construction Input Prices Increase to Start the Year

2025-02-13T11:17:12-06:00

Prices for inputs to new residential construction—excluding capital investment, labor, and imports—were up 1.2% in January according to the most recent Producer Price Index (PPI) report published by the U.S. Bureau of Labor Statistics. The Producer Price Index measures prices that domestic producers receive for their goods and services, this differs from the Consumer Price Index which measures what consumers pay and includes both domestic products as well as imports. The inputs to the New Residential Construction Price Index grew 1.1% from January of last year. The index can be broken into two components—the goods component increased 2.1% over the year, while services decreased 0.3%. For comparison, the total final demand index, which measures all goods and services across the economy, increased 3.5% over the year, with final demand with respect to goods up 2.3% and final demand for services up 4.1% over the year. Input Goods The goods component has a larger importance to the total residential construction inputs price index, representing around 60%. For the month, the price of input goods to new residential construction was up 1.6% in January. Monthly growth of the index was relatively low in the past two years, as this monthly increase was the largest since March of 2022 (3.3%). The input goods to residential construction index can be further broken down into two separate components, one measuring energy inputs with the other measuring goods less energy inputs. The latter of these two components simply represents building materials used in residential construction, which makes up around 93% of the goods index. The 2.1% yearly growth in the goods component can be attributed to the rise in the prices of building materials, which grew 2.3% over the year. Meanwhile, the price of energy inputs was 1.6% lower than last year. Between December and January, building materials increased 1.4%, while energy inputs increased 4.3%. At the individual commodity level, the five commodities with the highest importance for building materials to the New Residential Construction Index were as follows: ready-mix concrete, general millwork, paving mixtures/blocks, sheet metal products, and wood office furniture/store fixtures. Compared to last year, ready-mix concrete was up 4.1%, wood office furniture/store fixtures up 4.7%, general millwork up 2.4%, paving mixtures/blocks up 8.6% while sheet metal products were up 0.4%. For January, the commodity used in new residential construction that featured the highest price growth was an energy input, home heating oil and distillates, increasing 16.0%. The non-energy input that had the highest monthly price growth was paving mixtures and blocks, up 14.8%. This is likely a pass-through of increases in asphalt prices, which were up 6.9% in January. Input Services While prices of inputs to residential construction for services were down 0.3% over the year, they were up 0.5% in January from December. The price index for service inputs to residential construction can be broken out into three separate components: a trade services component, a transportation and warehousing services component, and a services excluding trade, transportation and warehousing component. The most significant component is trade services (around 60%), followed by services less trade, transportation and warehousing (around 29%), and finally transportation and warehousing services (around 11%). The largest component, trade services, was down 1.9% from a year ago. The services less trade, transportation and warehousing component was up 1.6% over the year.   Lastly, prices for transportation and warehousing services advanced 3.1% compared to January last year, the largest year-over-year increase since January of 2023. Discover more from Eye On Housing Subscribe to get the latest posts sent to your email.

Residential Construction Input Prices Increase to Start the Year2025-02-13T11:17:12-06:00

Inflation Accelerated in January

2025-02-12T11:16:50-06:00

Inflation edged up to a six-month high in January and showed little progress from a year ago. The persistent inflation rate indicates the last mile to the Fed’s 2% target continues to be challenging and is consistent with the Fed’s cautious stance amid solid economic growth and growing uncertainty. While core inflation remained stubborn due to elevated shelter and other service costs, housing costs showed signs of cooling – the year-over-year change in the shelter index remained below 5% for a fifth straight month and posted its lowest annual gain since January 2022, suggesting a continued moderation in housing inflation. While the Fed’s interest rate cuts could help ease some pressure on the housing market, its ability to address rising housing costs is limited, as these increases are driven by a lack of affordable supply and increasing development costs. In fact, tight monetary policy hurts housing supply because it increases the cost of AD&C financing. This can be seen on the graph below, as shelter costs continue to rise at an elevated pace despite Fed policy tightening. Additional housing supply is the primary solution to tame housing inflation. Furthermore, the election result has put inflation back in the spotlight and added additional upside and downside risks to the economic outlook. Proposed tax cuts and tariffs could increase inflationary pressures, suggesting a more gradual easing cycle with a slightly higher terminal federal funds rate. However, economic growth could also be higher with lower regulatory burdens. Given the housing market’s sensitivity to interest rates, a higher inflation path could extend the affordability crisis and constrain housing supply as builders continue to grapple with lingering supply chain challenges. During the past twelve months, on a non-seasonally adjusted basis, the Consumer Price Index rose by 3.0% in January, according to the Bureau of Labor Statistics’ report. This followed a 2.9% year-over-year increase in December. Excluding the volatile food and energy components, the “core” CPI increased by 3.3% over the past twelve months, following a 3.2% increase in December. The “core” CPI has held near 3.3% since May 2024. A large portion of the “core” CPI is the housing shelter index, which increased 4.4% over the year, following a 4.6% increase in December.  Meanwhile, the component index of food rose by 2.5%, and the energy component index increased by 1.0%. On a monthly basis, the CPI rose by 0.5% in January (seasonally-adjusted), after a 0.4% increase in December. The “core” CPI increased by 0.4% in January, the highest monthly gain since March 2024. The price index for a broad set of energy sources rose by 1.1% in January, with increases in gasoline (+1.8%), fuel oil (+6.2%), and natural gas (+1.8%), while the electricity index remained flat. Meanwhile, the food index rose 0.4%, after a 0.3% increase in December. The index for food away from home increased by 0.2% and the index for food at home rose by 0.5%. The index for shelter (+0.4%) was the largest contributor to the monthly increase in all items index, accounting for nearly 30% of the total increase. Other top contributors that rose in January include indexes for motor vehicle insurance (+2.0%), recreation (+1.0%), as well as used cars and trucks, (+2.2%). Meanwhile, the index for apparel (-1.4%), personal care (-0.1%) and household furnishings (-0.2%) and operations were among the few major indexes that decreased over the month. The index for shelter makes up more than 40% of the “core” CPI, rose by 0.4% in January, following an increase of 0.3% in December. Both indexes for owners’ equivalent rent (OER) and rent of primary residence (RPR) increased by 0.3% over the month. Despite the moderation, shelter costs remained the largest contributors to headline inflation.  NAHB constructs a “real” rent index to indicate whether inflation in rents is faster or slower than overall inflation. It provides insight into the supply and demand conditions for rental housing. When inflation in rents is rising faster than overall inflation, the real rent index rises and vice versa. The real rent index is calculated by dividing the price index for rent by the core CPI (to exclude the volatile food and energy components). In January, the Real Rent Index fell by 0.1%. This marks the first negative reading since December 2021. Discover more from Eye On Housing Subscribe to get the latest posts sent to your email.

Inflation Accelerated in January2025-02-12T11:16:50-06:00

About My Work

Phasellus non ante ac dui sagittis volutpat. Curabitur a quam nisl. Nam est elit, congue et quam id, laoreet consequat erat. Aenean porta placerat efficitur. Vestibulum et dictum massa, ac finibus turpis.

Recent Works

Recent Posts