Mortgage Applications Dip in May amid Refinance Slowdown

2025-06-04T12:20:31-05:00

Mortgage loan applications declined in May, driven by a drop for refinancing activity. According to the Mortgage Bankers Association (MBA) weekly survey, the Market Composite Index, which measures mortgage application volume, fell 5.5% month-over-month on a seasonally adjusted (SA) basis. Despite the monthly dip, application volume remains 23.7% higher than in May 2024. The average 30-year fixed mortgage rate rose for the second consecutive month, climbing 10 basis points to 6.9%. Purchase activity remained resilient, posting a modest 1.3% monthly gain from the previous month, while the Refinance Index declined 13.7% (SA). Compared to a year ago, mortgage rates are still 18 basis points lower, with purchase and refinance applications up 15.8% and 39.8%, respectively. Average loan sizes also declined. In May, the average loan amount for the overall market, which includes purchases and refinances, declined 3.1% to $390,800. Purchase loan sizes stayed flat at $443,600, while refinance loan sizes dropped 12.8% to $296,000. The average size for adjustable-rate mortgages (ARMs) ticked up 0.5%, from $1.05 million to $1.06 million. Discover more from Eye On Housing Subscribe to get the latest posts sent to your email.

Mortgage Applications Dip in May amid Refinance Slowdown2025-06-04T12:20:31-05:00

HBGI Q1 2025: Multifamily Growth in Smaller Markets

2025-06-03T14:20:31-05:00

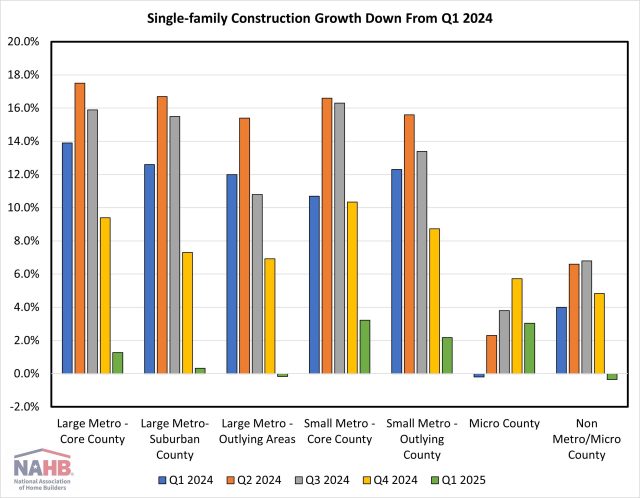
Single-family construction growth slowed substantially across all markets in the first quarter of 2025, according to the Home Building Geography Index (HBGI).  Multifamily construction growth remained negative in the largest markets but reported significant expansion in lower population density areas. The HBGI tracks single-family and multifamily permits across seven population density delineated geographies in the United States.   Single-Family Among the HBGI geographies, the highest growth in the first quarter of 2025 was registered in small metro core counties, which increased 3.2% year-over-year on a four-quarter moving average basis (4QMA). The market with the largest decline in growth between the fourth quarter and first quarter was large metro core counties, which saw its four-quarter moving average growth rate fall from 9.4% to 1.3% (-8.1 pp). Two geographies, large metro outlying areas and non metro/micro counties, reported declines in the first quarter, down 0.2% and 0.4% respectively. In terms of market share, single-family construction took place primarily in small metro core county areas, representing 29.2% of single-family construction. The smallest single-family construction market remained non metro/micro county areas, with a 4.2% market share. Single-family construction market share have been stable since the first quarter of 2024, with the largest gain being 0.4 percentage points in small metro core counties over the year.   Multifamily Multifamily construction expanded 33.2% in large metro outlying areas in the first quarter, the highest growth (4QMA) since the second quarter of 2022 when this geography grew 71.8%. Growth was present in three other geographies, with micro counties up 29.3%, small metro outlying counties up 18.5%, and non metro/micro counties up 3.7%. Because of the notable increase in multifamily construction occurring in smaller markets, market shares have shifted over the past two years. Large metro core counties, where a plurality of construction takes place, saw a 4.8 percentage point drop in market share between Q1 of 2024 and 2025. The largest construction gains have been in low population density areas, with the combined market share for small metro outlying counites, micro counties and non metro/micro counties growing 2.2 percentage points from 7.8% to 10.0% between Q1 2024 and 2025. The first quarter of 2025 HBGI data along with an interactive HBGI map can be found at http://nahb.org/hbgi. Discover more from Eye On Housing Subscribe to get the latest posts sent to your email.

HBGI Q1 2025: Multifamily Growth in Smaller Markets2025-06-03T14:20:31-05:00

Construction Job Openings Steady in April

2025-06-03T10:35:24-05:00

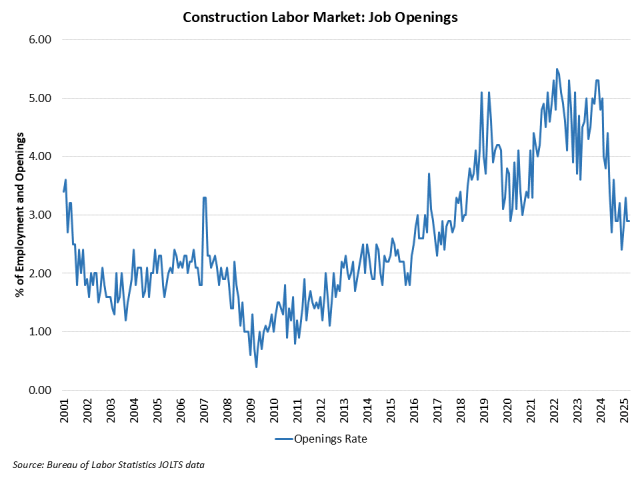
The count of open, unfilled positions in the construction industry held steady amid a slowdown for housing, per the April Bureau of Labor Statistics Job Openings and Labor Turnover Survey (JOLTS). The number of open jobs for the overall economy increased slightly from 7.20 million in March to 7.39 million in April. This is notably smaller than the 7.62 million estimate reported a year ago and reflects a softened aggregate labor market. Previous NAHB analysis indicated that this number had to fall below 8 million on a sustained basis for the Federal Reserve to move forward on interest rate reductions. With estimates remaining below 8 million for national job openings, the Fed, in theory, should be able to cut further despite a recent pause. However, tariff proposals may keep the Fed on pause in the coming quarters. The number of open construction sector jobs was effectively unchanged from a revised 251,000 in March to 248,000 in April. This nonetheless marks a significant reduction of open, unfilled construction jobs than that registered a year ago (326,000) due to a slowing of construction activity. The chart below notes the recent decline for the construction job openings rate, which is now back to the lows of 2019. The construction job openings rate was unchanged at 2.9% in April, although significantly lower year-over-year from 3.8%. The layoff rate in construction ticked higher to 1.9% in April. The quits rate dipped to 1.8% for the month. Discover more from Eye On Housing Subscribe to get the latest posts sent to your email.

Construction Job Openings Steady in April2025-06-03T10:35:24-05:00

Mixed Conditions for Single-Family Construction, Apartment Boost in Smaller Metros

2025-06-03T10:35:09-05:00

Single-family construction growth registered modest gains in small metro areas and declines in large metro counties while apartment growth is shifting to counties with lower population densities, according to the latest National Association of Home Builders (NAHB) Home Building Geography Index (HGBI) for the first quarter of 2025 released today.

Mixed Conditions for Single-Family Construction, Apartment Boost in Smaller Metros2025-06-03T10:35:09-05:00

REALTORS® Help You Bring It Home

2025-06-03T00:20:44-05:00

REALTORS® are your trusted partner in a real estate transaction. Here are a few of the countless ways that members of Texas REALTORS® support you when you buy, sell, or lease real estate. REALTORS® offer expert guidance: They bring unmatched knowledge and experience to every step, helping you make informed decisions while managing details that could feel overwhelming. REALTORS® have reliable data: With up-to-date market analysis, REALTORS® help buyers pay the right price and sellers make competitive listings. REALTORS® streamline your search: From showings to paperwork, REALTORS® simplify your journey and save you time and energy. REALTORS® are skilled negotiators: They prioritize your best interests, leveraging their expertise to secure favorable terms. REALTORS® expand your opportunities: Whether it’s connecting you to trusted lenders or uncovering downpayment-assistance programs, REALTORS® have the resources to support you. Visit texasrealestate.com/bringithome for more information about how valuable REALTORS® are no matter your real estate needs.

REALTORS® Help You Bring It Home2025-06-03T00:20:44-05:00

April Private Residential Construction Spending Dips

2025-06-02T11:19:06-05:00

Private residential construction spending fell by 0.9% in April, marking the third consecutive monthly decline. This decrease was primarily driven by reduced spending in single-family construction and home improvements. Compared to a year ago, total spending was down 4.8%, as the housing sector continues to navigate the economic uncertainty stemming from ongoing tariff concerns and elevated mortgage rates. According to the latest U.S. Census Construction Spending data, single-family construction spending declined by 1.1% in April. This decrease aligns with the weakness in the April single-family starts and NAHB/Wells Fargo Housing Market Index (HMI). The April data ends seven months of growth in single-family construction spending, making it 2.2% lower than a year ago. Meanwhile improvement spending was down 0.8% in April and was 5.5% lower on a year-over-year basis. Multifamily construction spending edged down 0.1% in April, staying in the downward trend that began in December 2023. Compared to April 2024, multifamily spending was down 11.3%. The NAHB construction spending index is shown in the graph below. The index illustrates how   spending on single-family construction has slowed since early 2024 under the pressure of elevated interest rates and concerns over building material tariffs. Multifamily construction spending growth has also slowed down after the peak in July 2023. Improvement spending has also been weakening since the beginning of 2025. Spending on private nonresidential construction was up 1% over a year ago. The annual private nonresidential spending increase was mainly due to higher spending for the class of power ($7.9 billion), followed by the office category ($3.3 billion). Discover more from Eye On Housing Subscribe to get the latest posts sent to your email.

April Private Residential Construction Spending Dips2025-06-02T11:19:06-05:00

About My Work

Phasellus non ante ac dui sagittis volutpat. Curabitur a quam nisl. Nam est elit, congue et quam id, laoreet consequat erat. Aenean porta placerat efficitur. Vestibulum et dictum massa, ac finibus turpis.

Recent Works

Recent Posts