Inadequate Shelter: Millions of U.S. Homes Fail to Meet Standards

2025-03-05T09:16:41-06:00

In 2023, nearly 6.45 million homes, around 5% of U.S housing stock, were classified as inadequate according to the American Housing Survey (AHS). Of these, 1.65 million homes were classified as severely inadequate, showing significant concerns over housing quality. While this reveals ongoing issues in nation’s housing conditions, it signals probable market growth for remodeling and home improvements in the year ahead. The U.S. Department of Housing and Urban Development (HUD) defines physical adequacy based on whether a home meets the basic standard of “a decent home and a suitable living environment”. Homes are severely inadequate if they exhibit major deficiencies, such as exposed wiring, lack of electricity, missing hot or cold running water, or the absence of heating or cooling systems. Additionally, homes with at least five significant structural problems such as water leaks, large open cracks or holes in the floor also belong to this category.  Moderately inadequate homes have three or four significant structural issues, or have problems such as incomplete kitchen facilities, lack of vented heating equipment, or prolonged toilet breakdowns. Housing inadequacy has remained a persistent issue over the past decade, shown in Figure 1.  In 2023, around 6.5 million households lived in moderately or severely inadequate housing. While the total number of inadequate homes declined slightly from 6.9 million in 2015 to 6.0 million in 2019, it rebounded to 6.7 million in 2021 and remained elevated in 2023.  The majority, around 4.8 million, of inadequate homes were moderately inadequate, while 1.65 million households lived in severely inadequate conditions in 2023. The share of inadequate homes varies significantly by the age of the home (Figure 2). Older homes have higher rates of inadequacy. Homes built before 1940 have the highest inadequacy rate at 9%, followed by those built between 1940 and 1959 at 7%. While housing units from 1960 to 1979 show a moderate inadequacy rate of 5%, they account for the largest number of inadequate homes, with 1.2 million classified as moderately inadequate and 465,000 as severely inadequate in 2023. In contrast, newer homes (1980-Present) have lower inadequacy rates with the share steadily declining from 4% for homes built between 1980 and 1999 to 3% for those constructed from 2000 to the present. Geographically, inadequate housing is most concentrated in smaller metro areas. Around 50.4% of moderately inadequate homes (2.4 million units) and 43.6% of severely inadequate homes (720,000 units) are in these areas in 2023. This trend is likely driven by aging housing stock and lower household income compared to major metro areas. However, major metro areas still have a substantial share of inadequate homes, with 29.7% of moderately inadequate (1.4 million) and 38.2% of severely inadequate units (631,000). Non-metro areas have the lowest total numbers, (953,000 moderately inadequate and 720,000 severely inadequate homes), though challenges persist. In 2023, around 6.45 million households lived in inadequate housing, with more renters (3.5 million) than owners (2.8 million). Housing cost burdens varied greatly among these two groups: Among those households in inadequate homes, 1.9 million owners spent less than 30% of their income on housing, compared to 1.6 million renters. It suggests that many homeowners living in inadequate housing may indeed have the financial capacity to improve their housing conditions if they choose to do so. In contrast, renters in inadequate housing face greater financial constraints, with 1.1 million spending more than 50% of their income on housing, more than double the 480,000 cost-burdened owners. This disparity highlights the challenges renters are facing, including limited affordable housing options and a lack of control over property conditions. Discover more from Eye On Housing Subscribe to get the latest posts sent to your email.

Inadequate Shelter: Millions of U.S. Homes Fail to Meet Standards2025-03-05T09:16:41-06:00

HBGI Q4 2024: Single-Family Construction Ends Year with Growth

2025-03-04T10:16:43-06:00

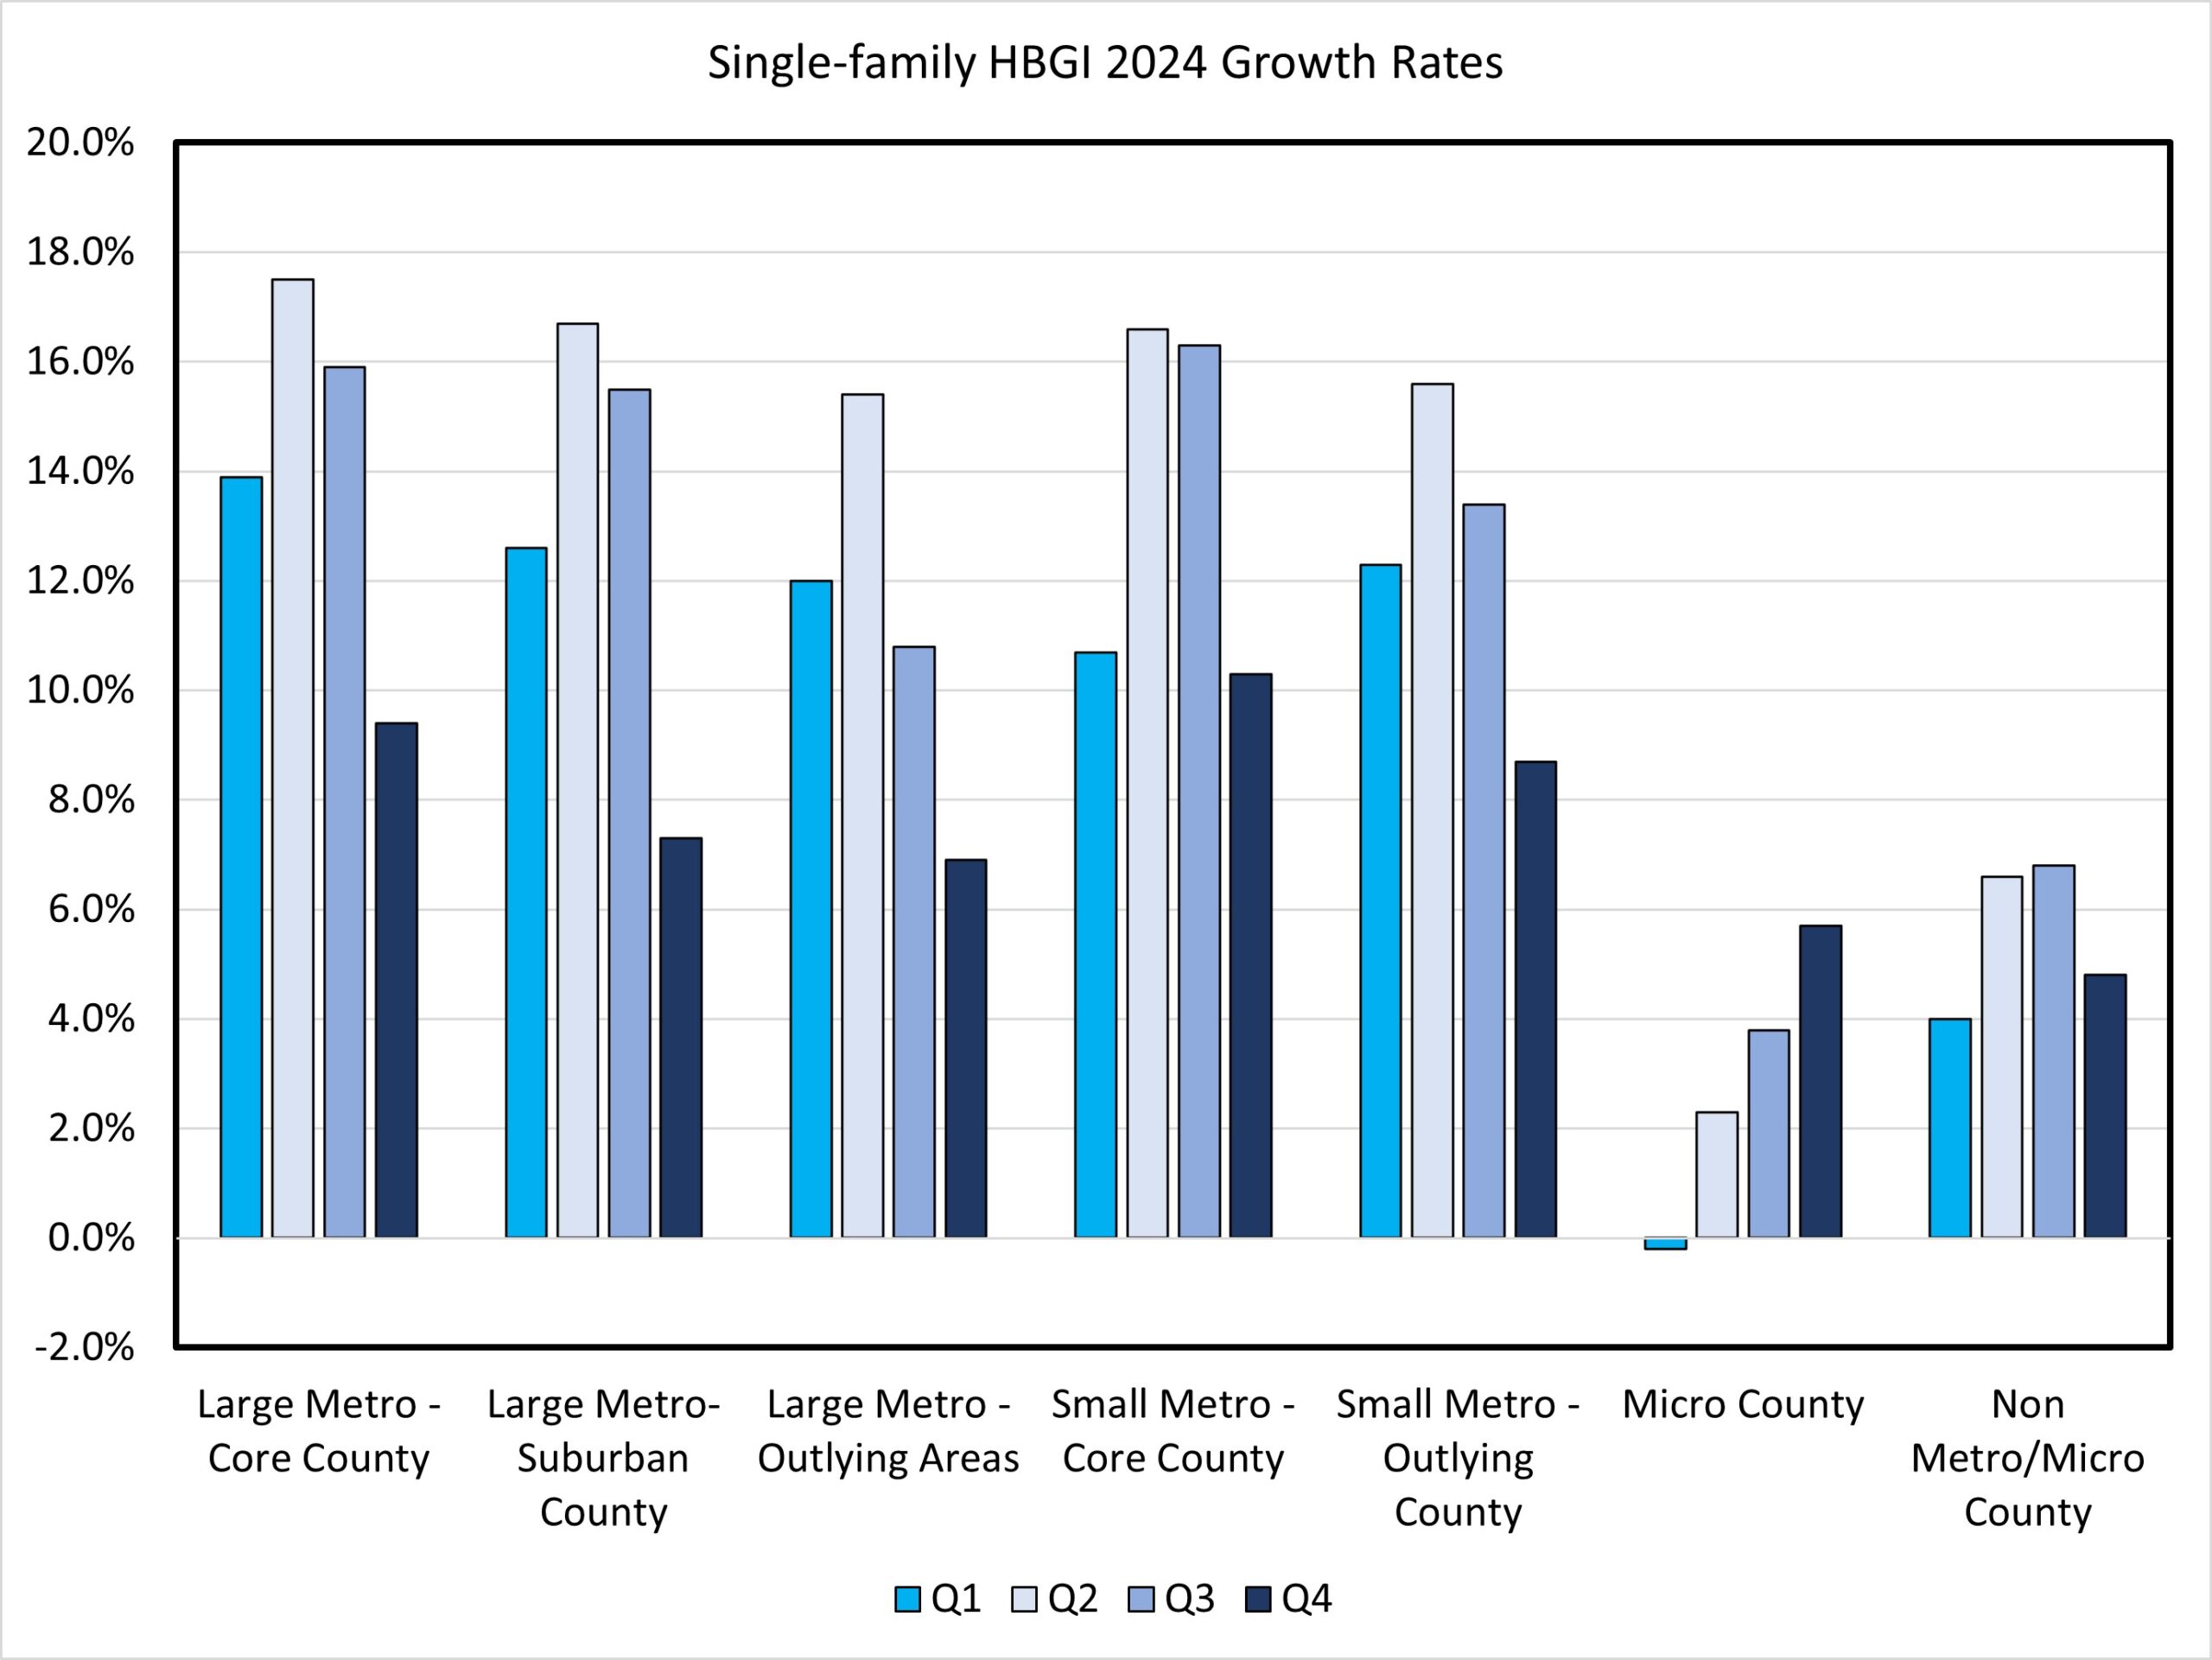
The continued shortage of existing homes for sale has helped to keep new single-family construction growing across all regions, according to the latest National Association of Home Builders release of the Home Building Geography Index (HBGI). Despite persistent factors that continue to affect housing affordability, including a limited supply of buildable lots, rising construction costs, and a shortage of skilled labor, single-family construction grew over all four quarters of 2024. Multifamily construction remained lackluster but did feature some growth in lower density areas. Single-Family All HBGI-tracked geographies posted another quarter of growth in the fourth quarter after peaking in the second quarter. The HBGI is constructed using permit data, which has continued to post higher volumes than last year despite residential construction dealing with persistent structural issues. Among the HBGI geographies, the highest growth in the fourth quarter of 2024 was registered in small metro core counties, which increased 10.3% year-over-year on a four-quarter moving average basis (4QMA). The market with the lowest level of growth was non metro/micro counties which were up 4.8% year-over-year (4QMA). In terms of market share, single-family construction took place primarily in small metro core county areas, representing 29.1% of single-family construction. The smallest single-family construction market remained non metro/micro county areas, with a 4.2% market share. Multifamily Multifamily construction continued to register negative growth rates across the largest markets, with large metro core county areas posting a decline of 13.5% quartering in the fourth quarter (4QMA). While permit levels remain lower for new multifamily construction, there were some positive signs in less densely populated areas. Small metro outlying county areas had the largest growth rate in the fourth quarter at 9.0%, the second consecutive quarter of growth. These areas make up around 5.0% of the total multifamily construction market. The fourth quarter of 2024 HBGI data along with an interactive HBGI map can be found at http://nahb.org/hbgi. Discover more from Eye On Housing Subscribe to get the latest posts sent to your email.
HBGI Q4 2024: Single-Family Construction Ends Year with Growth2025-03-04T10:16:43-06:00

Is Your Home Priced Too High?

2025-03-04T01:15:01-06:00

Even if your house is staged and well-maintained, it is only worth what the market will bear. To increase your chance of a quick sale, consider these signs that it may be time to adjust your selling price. Low Traffic Are you limiting your exposure? Since most buyers sort listings by price and location, your home might not be showing up in search results when compared to other properties in the area. Long Time on Market A recently renovated kitchen or bathroom often increases the home’s value. However, if your home has been on the market for a while with no viable offers, that could be an indication that the upgrades don’t match the buyer’s expectations. Homes Nearby Selling Faster Buyers often compare several listings to find the best value before making a decision. Have you done a comparative market analysis to make sure you are remaining competitive? Receiving Negative Feedback Sentimental value can often be a driving force in setting the price of the home. To get a more realistic view of your home’s worth, learn how potential buyers perceive your property by paying attention to the feedback from showings. Ensuring that your home is competitively priced is a crucial step in the selling process. Ask your REALTOR® to assess the current market and help you set the highest realistic price for your home.

Is Your Home Priced Too High?2025-03-04T01:15:01-06:00

January Private Residential Construction Spending Dips

2025-03-03T13:20:08-06:00

Private residential construction spending declined by 0.4% in January, largely driven by a decrease in multifamily construction and home improvement spending. This decline followed three consecutive months of growth, indicating a downward shift in the monthly data.  Despite the monthly drop, spending remains 3.1% higher than a year ago, showing the resilience of the housing market.   According to the latest U.S Census Construction Spending data, multifamily construction spending fell by 0.7% for the month, extending the downward trends that began in December 2023. This decline aligns with the weakness in the Multifamily Production Index (MPI) and a lower number of multifamily homes under construction. Improvement spending declined by 1.5% in January but was 14.3% higher compared to the same period last year. Meanwhile, spending on single-family construction rose by 0.6% in January, continuing its growth after a  five-month decline from April to August. This growth also aligns with steady builder confidence seen in the Housing Market Index. However, single-family construction remained 0.9% lower than a year ago. The NAHB construction spending index is shown in the graph below. The index illustrates how   spending on single-family construction has slowed since early 2024 under the pressure of elevated interest rates and concerns over building material tariffs. Multifamily construction spending growth has also slowed down after the peak in July 2023. Meanwhile, improvement spending has increased its pace since late 2023. Spending on private nonresidential construction was up 1.8% over a year ago. The annual private nonresidential spending increase was mainly due to higher spending for the class of manufacturing ($12.4 billion), followed by the power category ($5.5 billion). Discover more from Eye On Housing Subscribe to get the latest posts sent to your email.
January Private Residential Construction Spending Dips2025-03-03T13:20:08-06:00

About My Work

Phasellus non ante ac dui sagittis volutpat. Curabitur a quam nisl. Nam est elit, congue et quam id, laoreet consequat erat. Aenean porta placerat efficitur. Vestibulum et dictum massa, ac finibus turpis.

Recent Works

Recent Posts