National Flood Insurance Program Could Lapse on March 15

2025-03-13T13:21:32-05:00

With the federal government possibly heading to a shutdown at 12:01 a.m. on Saturday, March 15, the most immediate impact on the housing sector will be a lapse of the National Flood Insurance Program (NFIP), which could have widespread impacts on property sales.

National Flood Insurance Program Could Lapse on March 152025-03-13T13:21:32-05:00

Softwood Lumber Prices Continue to Lead Price Growth for Building Materials

2025-03-13T11:20:23-05:00

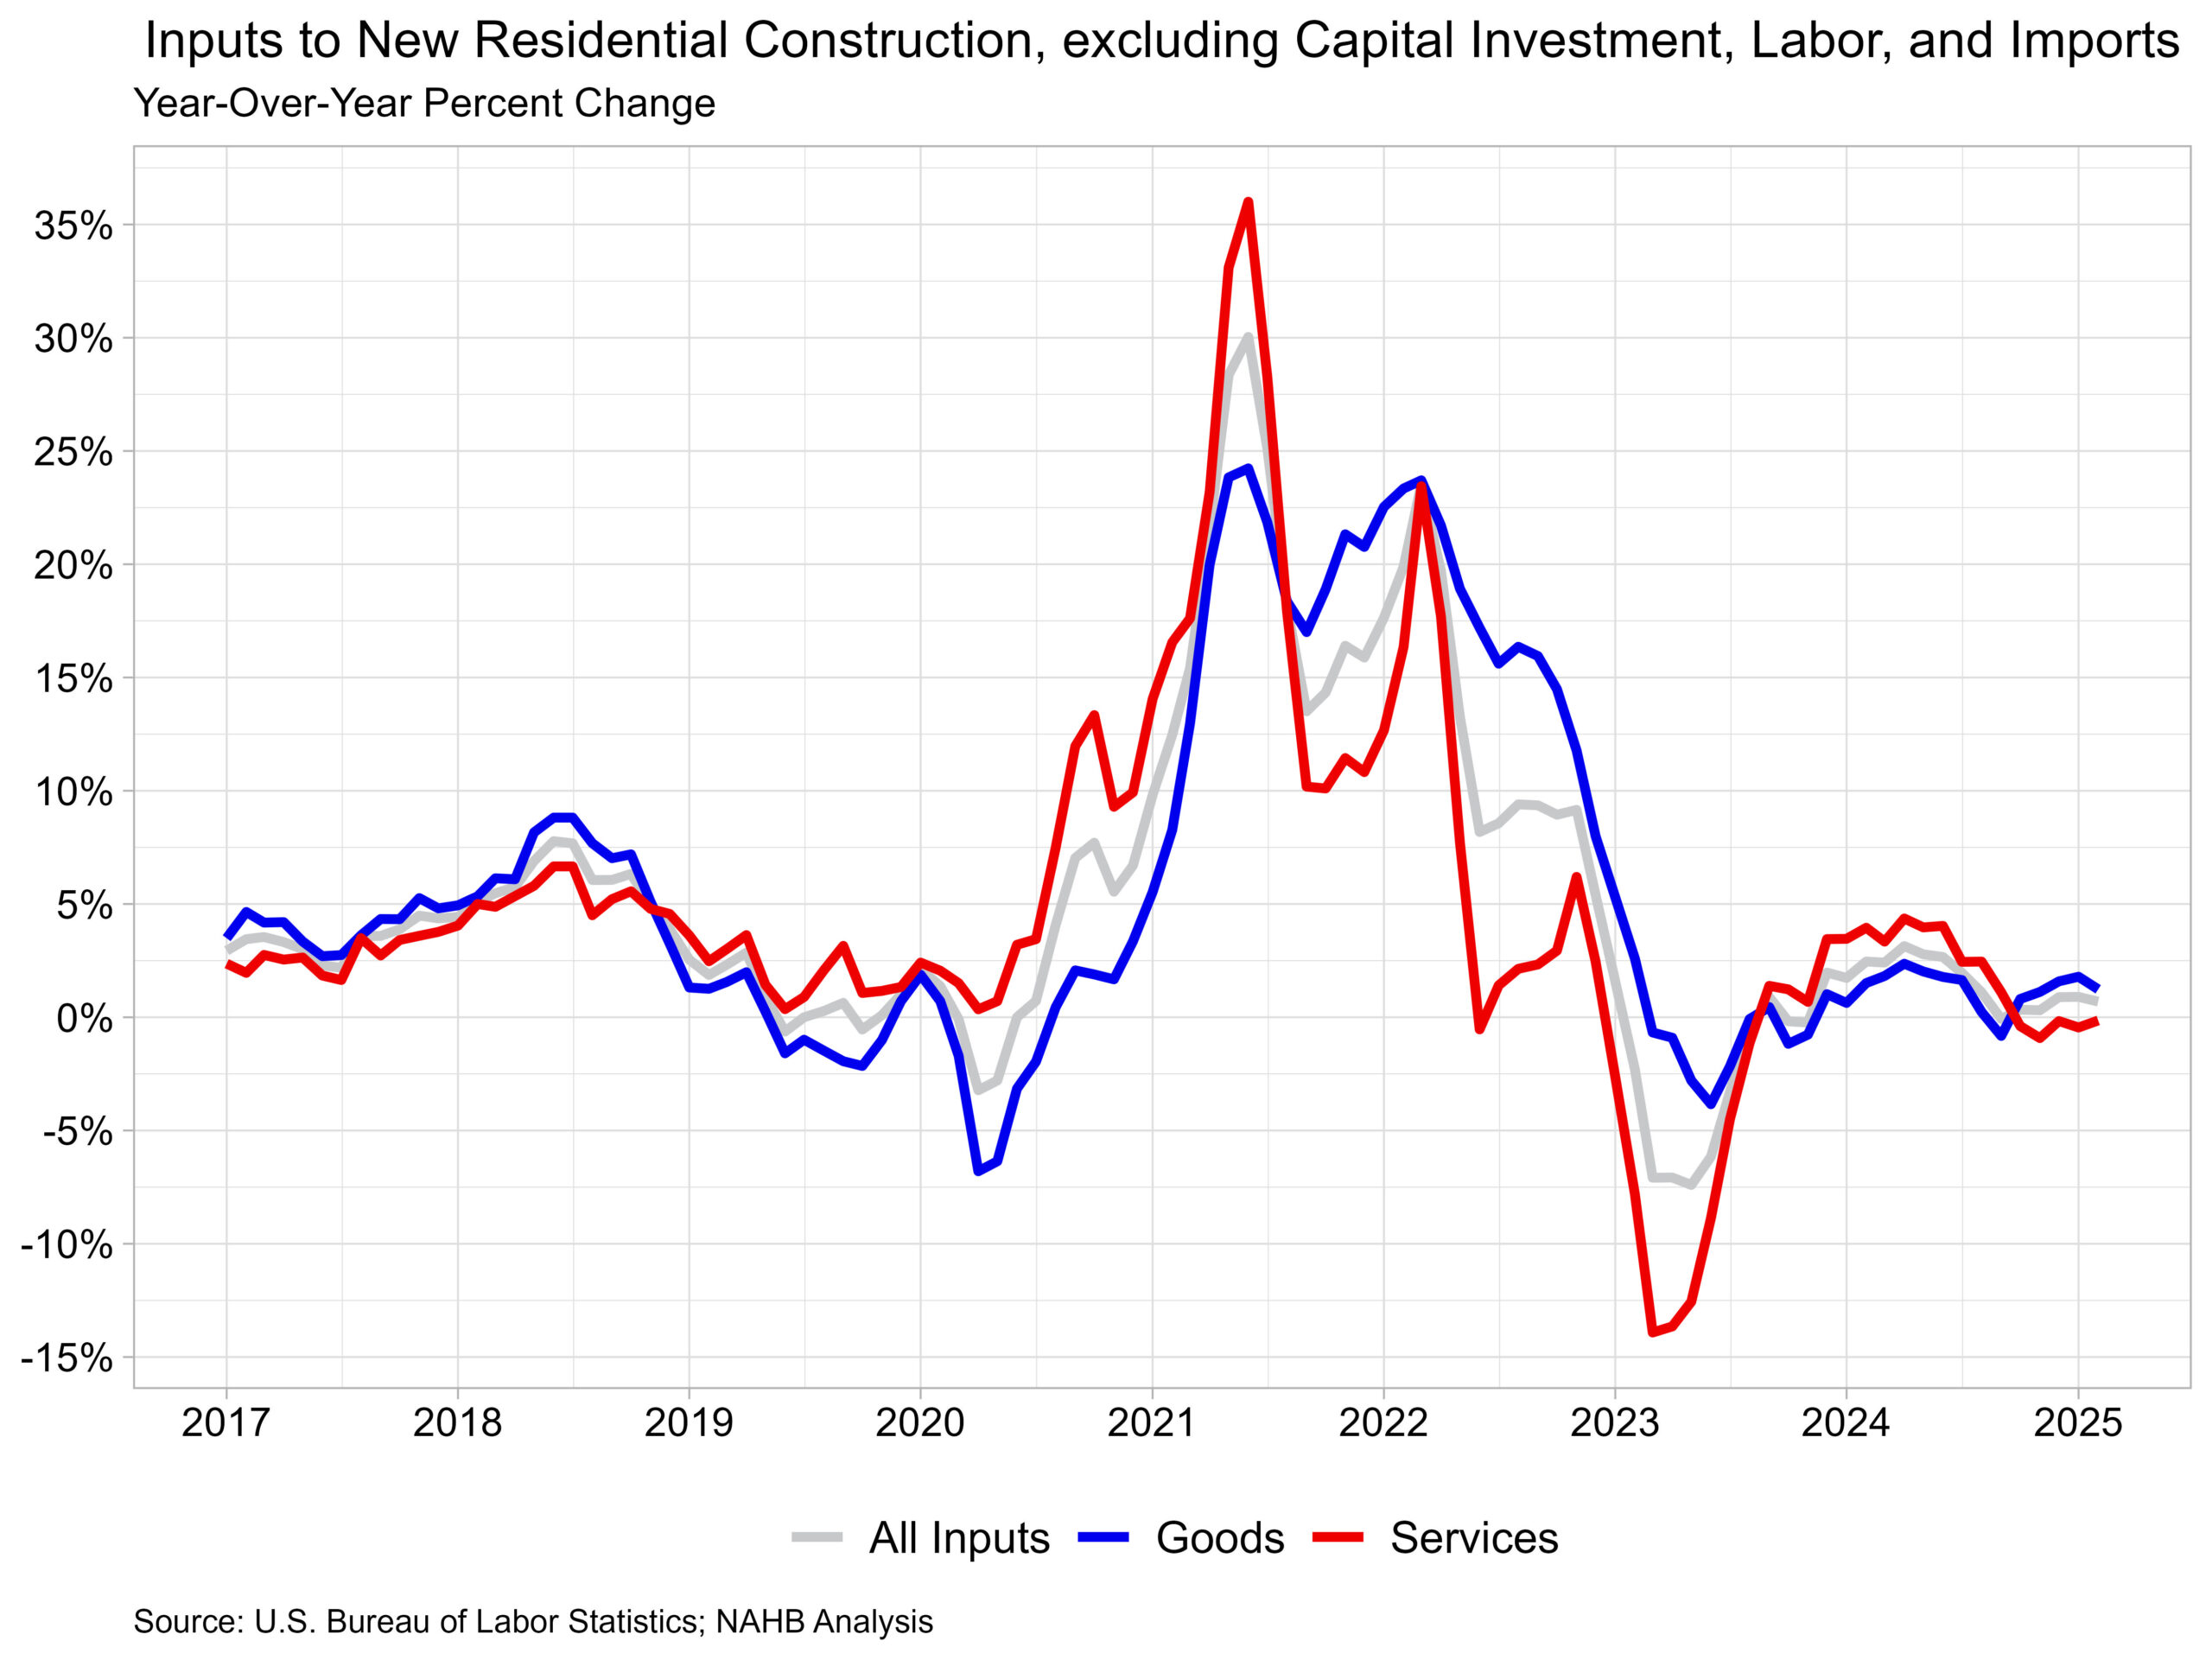
Prices for inputs to new residential construction—excluding capital investment, labor, and imports—were up 0.5% in February according to the most recent Producer Price Index (PPI) report published by the U.S. Bureau of Labor Statistics. The increase in January was revised downward to 1.1%. The Producer Price Index measures prices that domestic producers receive for their goods and services, this differs from the Consumer Price Index which measures what consumers pay and includes both domestic products as well as imports. The inputs to the New Residential Construction Price Index grew 0.7% from February of last year. The index can be broken into two components—the goods component increased 1.2% over the year, while services decreased 0.1%. For comparison, the total final demand index, which measures all goods and services across the economy, increased 3.2% over the year, with final demand with respect to goods up 1.7% and final demand for services up 3.9% over the year. Input Goods The goods component has a larger importance to the total residential construction inputs price index, representing around 60%. For the month, the price of input goods to new residential construction was up 0.6% in February. The input goods to residential construction index can be further broken down into two separate components, one measuring energy inputs with the other measuring goods less energy inputs. The latter of these two components simply represents building materials used in residential construction, which makes up around 93% of the goods index. Energy input prices grew 2.6% between January and February but remained 8.5% lower compared to one year ago. Building material prices were up 0.5% between January and February while they were up 2.0% compared to one year ago. Among materials used in residential construction, lumber and wood products ranks 3rd in terms of importance for the Inputs to New Residential Construction Index. Nonmetallic mineral products and metal products rank 1st and 2nd, respectively. The top lumber and wood products include general millwork, prefabricated structural members, not-edge worked softwood lumber, softwood veneer/plywood and hardwood veneer/plywood. Prices for these wood commodities experienced little growth for most of 2024. Currently, softwood lumber prices were 11.7% higher compared to one year ago while on a monthly basis, prices rose 3.0%. This marks the fourth straight month where yearly price growth was above 10% for softwood lumber. Input Services While prices of inputs to residential construction for services were down 0.1% over the year, they were up 0.4% in February from January. The price index for service inputs to residential construction can be broken out into three separate components: a trade services component, a transportation and warehousing services component, and a services excluding trade, transportation and warehousing component. The most significant component is trade services (around 60%), followed by services less trade, transportation and warehousing (around 29%), and finally transportation and warehousing services (around 11%). The largest component, trade services, was down 1.5% from a year ago. The services less trade, transportation and warehousing component was up 1.6% over the year.  Lastly, prices for transportation and warehousing services advanced 2.2% compared to February last year. Discover more from Eye On Housing Subscribe to get the latest posts sent to your email.

Softwood Lumber Prices Continue to Lead Price Growth for Building Materials2025-03-13T11:20:23-05:00

Inflation Eased Ahead of Tariffs

2025-03-12T10:20:03-05:00

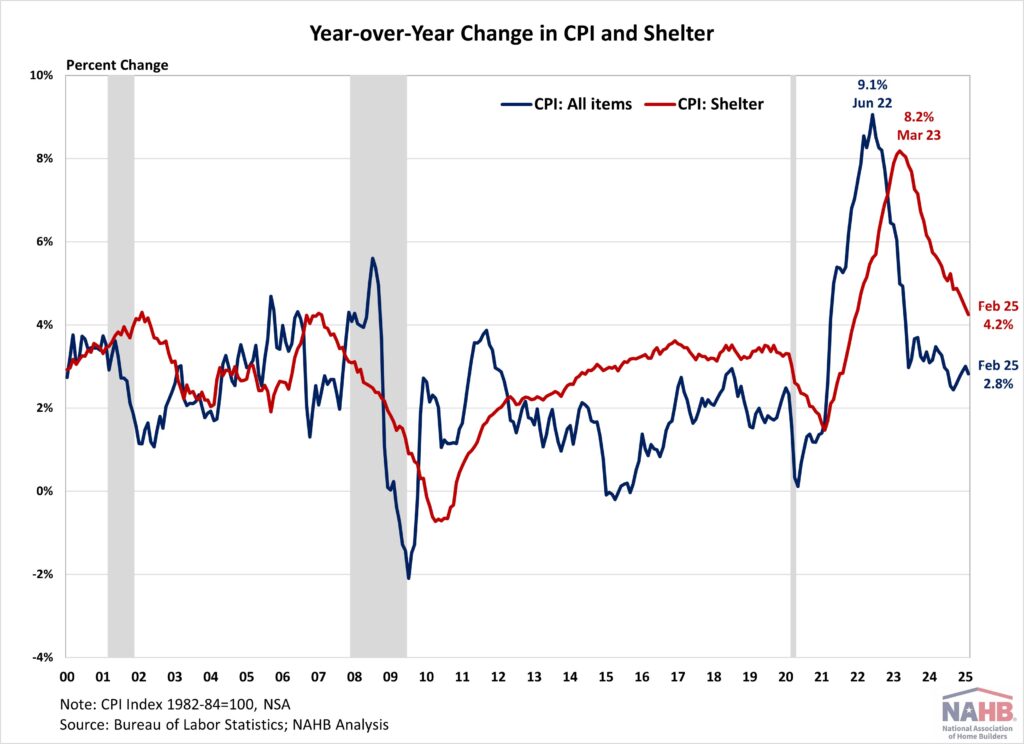
Inflation slowed to a 3-month low in February, with decreases in airfares and gasoline partially offsetting shelter increases. Despite the easing, the report does not capture upcoming tariff impacts. The inflationary pressure from tariffs and trade war would weigh on the economy and complicate the Fed’s path to its 2% target. Meanwhile, while housing drove nearly half of February’s inflation increase and remains higher than the 2019 pre-pandemic average of 3.4%, it continues to show signs of cooling – the year-over-year change in the shelter index remained below 5% for a sixth straight month and posted its lowest annual gain since December 2021.  While the Fed’s interest rate cuts could help ease some pressure on the housing market, its ability to address rising housing costs is limited, as these increases are driven by a lack of affordable supply and increasing development costs. In fact, tight monetary policy hurts housing supply because it increases the cost of AD&C financing. This can be seen on the graph below, as shelter costs continue to rise at an elevated pace despite Fed policy tightening. Additional housing supply is the primary solution to tame housing inflation and with it, overall inflation. This emphasizes why the cost of construction, including the cost of building materials, matters not just for housing but also the inflation outlook and the path of future monetary policy. Consequently, the election result has put inflation back in the spotlight and added additional upside and downside risks to the economic outlook. Proposed tax cuts and tariffs could increase inflationary pressures, suggesting a more gradual easing cycle with a slightly higher terminal federal funds rate. However, economic growth could also be higher with lower regulatory burdens. Given the housing market’s sensitivity to interest rates, a higher inflation path could extend the affordability crisis and constrain housing supply as builders continue to grapple with lingering supply chain challenges. During the past twelve months, on a non-seasonally adjusted basis, the Consumer Price Index rose by 2.8% in February, according to the Bureau of Labor Statistics’ report. This followed a 3.0% year-over-year increase in January. Excluding the volatile food and energy components, the “core” CPI increased by 3.1% over the past twelve months, marking the first notable decline after hovering between 3.2% and 3.3% since June 2024. A large portion of the “core” CPI is the housing shelter index, which increased 4.2% over the year, the smallest year-over-year increase since December 2021.  Meanwhile, the component index of food rose by 2.6%, and the energy component index fell by 0.2%. On a monthly basis, the CPI rose by 0.2% in February (seasonally-adjusted), after a 0.5% increase in January. The “core” CPI increased by 0.2% in February. The price index for a broad set of energy sources rose by 0.2% in February, with declines in gasoline (-1.0%) offset by increases in electricity (+1.0%), natural gas (+2.5%) and fuel oil (+0.8%). Meanwhile, the food index rose 0.2%, after a 0.4% increase in January. The index for food away from home increased by 0.4% and the index for food at home remained unchanged. The index for shelter (+0.3%) was the largest contributor to the monthly increase in all items index, accounting for nearly half of the total increase. Other top contributors that rose in February include indexes for medical care (+0.3%), used cars and trucks (+0.9%), household furnishings and operations (+0.4%), as well as recreation (+0.3%). Meanwhile, the index for airline fares (-4.0%) and new vehicles (-0.1%) were among the few major indexes that decreased over the month. The index for shelter makes up more than 40% of the “core” CPI, rose by 0.3% in February, following an increase of 0.4% in January. Both indexes for owners’ equivalent rent (OER) and rent of primary residence (RPR) increased by 0.3% over the month. Despite the moderation, shelter costs remained the largest contributors to headline inflation.  NAHB constructs a “real” rent index to indicate whether inflation in rents is faster or slower than core inflation. It provides insight into the supply and demand conditions for rental housing. When inflation in rents is rising faster than core inflation, the real rent index rises and vice versa. The real rent index is calculated by dividing the price index for rent by the core CPI (to exclude the volatile food and energy components). In January, the Real Rent Index rose by 0.1%. Over the first two months of 2025, the monthly growth rate of the Real Rent Index averaged remained flat at 0.0%, unchanged from the same period in 2024. Discover more from Eye On Housing Subscribe to get the latest posts sent to your email.

Inflation Eased Ahead of Tariffs2025-03-12T10:20:03-05:00

Year-over-Year Declines for Construction Job Openings

2025-03-11T12:15:39-05:00

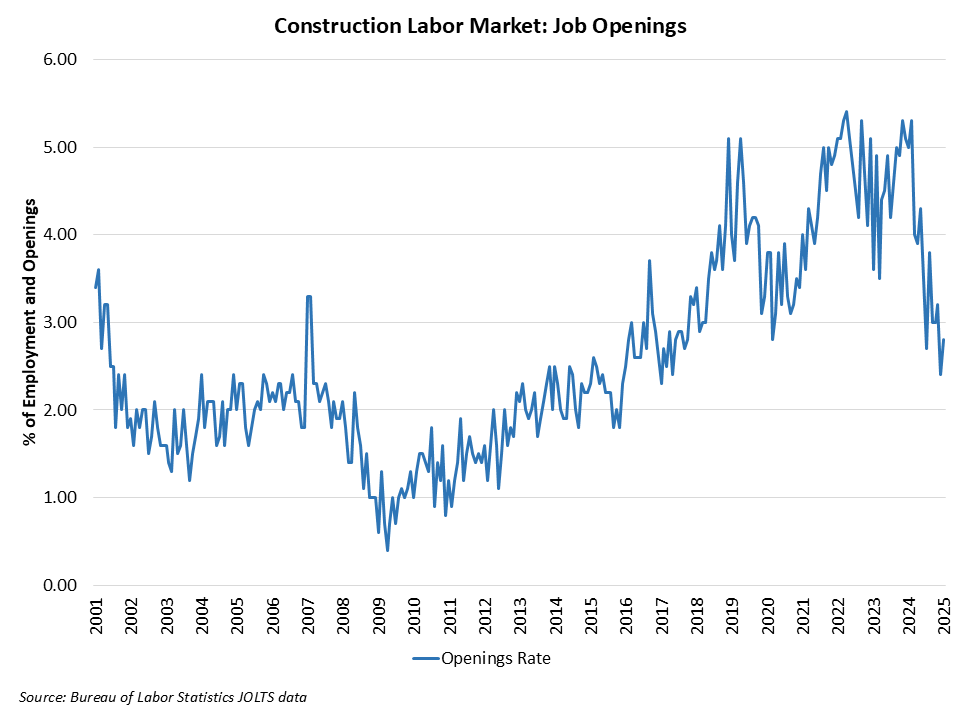
After a period of slowing associated with declines for some elements of the residential construction industry, the count of open construction sector jobs remained lower than a year ago, per the January Bureau of Labor Statistics Job Openings and Labor Turnover Survey (JOLTS). The number of open jobs for the overall economy increased from 7.51 million in December to 7.74 million in January. This is notably smaller than the 8.47 million estimate reported a year ago and reflects a softened aggregate labor market. Previous NAHB analysis indicated that this number had to fall below 8 million on a sustained basis for the Federal Reserve to feel more comfortable about labor market conditions and their potential impacts on inflation. With estimates remaining below 8 million for national job openings, the Fed in theory should be able to cut further despite a recent pause. However, tariff proposals may keep the Fed on pause in the coming quarters. The number of open construction sector jobs increased from a revised 205,000 in December to 236,000 in January. This nonetheless marks a significant reduction of open, unfilled construction jobs than that registered a year ago (407,000) due to a slowing of construction activity because of ongoing elevated interest rates. The construction job openings rate edged higher to 2.8% in January, significantly down year-over-year from 4.8%. The layoff rate in construction stayed low (1.8%) in January. The quits rate moved higher to 2% in January, near to its rate from a year ago. Discover more from Eye On Housing Subscribe to get the latest posts sent to your email.

Year-over-Year Declines for Construction Job Openings2025-03-11T12:15:39-05:00

Builders’ Profit Margins Improved in 2023

2025-03-11T09:16:47-05:00

Profitability for single-family home builders reached the highest levels in more than a decade in 2023.  Industrywide profit benchmarks are important because they allow companies to compare their financial performance against the entire industry.  Doing so can guide resource allocation, budgeting, and target setting for costs and expense lines.  More broadly, understanding industry benchmarks can lead to an improved business strategy and to higher financial results.  On average, builders reported $11.3 million in total revenue for fiscal year 2023.  Of that, about $9.0 million (79.3%) was spent on cost of sales (i.e., land, direct and indirect construction costs), which translates into an average gross profit margin of 20.7%.  Operating expenses (i.e., finance, S&M, G&A, and owner’s compensation) cost builders an average of $1.4 million (12.0% of revenue), leaving them with an average net profit margin of 8.7%.  This post summarizes the results from NAHB’s most recent edition of the Builders’ Cost of Doing Business Study. Based on historical survey data (performed every three years), the 20.7% average gross profit margin in 2023 was the highest registered since 2006 (20.8%).  As a point of reference, builders’ gross margin sank to a record low of 14.4% in 2008 (i.e., during the housing recession), but bounced back steadily through 2017 (19.0%).  The onset of COVID-19 in 2020 increased costs, causing builders’ average gross margin to drop (18.2%) for the first time since 2008. The 8.7% average net profit margin for fiscal year 2023 is the highest in this survey’s recent history, exceeding the 7.7% reported in 2006.  However, increased use of financial incentives, such as mortgage rate buydowns, and cuts in home prices are likely to have caused this margin to shrink in 2024. The Cost of Doing Business Study also tracks builders’ balance sheets.  On average, builders reported $7.2 million in total assets on their 2023 balance sheets.  Of that, $4.5 million (62%) was financed by liabilities (either short- or long-term) and the other $2.7 million (38%) by equity builders held in their companies. Historical data show the average $7.2 million in total assets in 2023 was 23% lower than in 2020 ($9.4 million), and builders’ lowest asset level since 2010 ($6.2 million).  But perhaps more important than fluctuations in the size of their balance sheets, the data reveal a long-term decline in builders’ reliance on debt to finance their operations: in 2006, 74% of their assets were backed up by debt; by 2020, the share was down 10 points to 64%; and by 2023, it dropped to a record low of 62%. Logically, the latter means builders are using more of their own capital to run their companies, as illustrated by their equity share rising from 26% of assets in 2006 to 38% in 2023. The NAHB Economics team will conduct a Cost of Doing Business Study for residential remodelers in the spring of 2025. If that is your firm’s primary activity, please consider participating in this confidential survey. We simply can’t produce benchmarks without your input.  To participate, please complete this form. A summary of the most recent profitability benchmarks for residential remodelers is available in this blog post. Discover more from Eye On Housing Subscribe to get the latest posts sent to your email.

Builders’ Profit Margins Improved in 20232025-03-11T09:16:47-05:00

How Rising Costs Affect Home Affordability

2025-03-10T09:19:44-05:00

Housing affordability remains a critical issue, with 74.9% of U.S. households unable to afford a median-priced new home in 2025, according to NAHB’s latest analysis. With a median price of $459,826 and a 30-year mortgage rate of 6.5%, this translates to around 100.6 million households priced out of the market, even before accounting for further increases in home prices or interest rates. A $1,000 increase in the median price of new homes would price an additional 115,593 households out of the market. The 2024 priced-out estimates for all states and the District of Columbia and over 300 metropolitan statistical areas are shown in the interactive map below. It highlights the growing housing affordability challenges across the United States. In 23 states and the District of Columbia, over 80% of households are priced out of the median-priced new home market. This indicates a significant disconnect between rising home prices and household incomes. Maine stands out as the state with the highest share of households (91.2%) unable to afford the state’s median new home price of $682,223. High-cost states such as Connecticut and Rhode Island follow closely, with 88.3% and 87.8% of households, respectively, struggling to afford new homes. Even in states with relatively lower median new home prices, affordability remains a major concern. For example, in Mississippi, where the median home price is $275,333, 70.2% of households still find these new homes out of reach. Meanwhile, Delaware, the state with better affordability in the analysis, has a median new home price of $373,666. However, around 58.2% of households in Delaware still struggle to afford a new home. Even modest price increases, such as an additional $1,000, could push thousands more households from affording these median priced new homes. For instance, in Texas, such an increase could price out over 11,000 households. It also shows the 2025 priced-out estimates for over 300 metropolitan statistical areas. The analysis estimates how many households in each metro area earn enough income to qualify for mortgages on median-priced new homes. In high-cost areas like the San Jose-Sunnyvale-Santa Clara, CA metro area, where new homes largely target high-income Silicon Valley residents, only 10% of all households meet the minimum income threshold of $437,963 required to qualify for a loan on a median priced new home. In contrast, in more affordable metro areas like Sierra Vista-Douglas, AZ, where the median new home price is $150,893, nearly two-thirds of households can afford a median priced new home. While higher home prices generally result in higher monthly mortgage payments and higher income thresholds, the relationship between home prices and affordability is not always linear. Factors like property taxes and insurance payments can also significantly impact monthly housing costs, adding complexity to affordability calculations. The affordability of new homes and together with the population size of a metro area, significantly influence the priced-out impact of a $1,000 increase in new home prices. In metro areas where new homes are already unaffordable to most households, the effect of such an increase tends to be small. For instance, in the San Jose-Sunnyvale-Santa Clara, CA metro area, an additional $1,000 increase to the home price affects only 259 households, as only 10% of all households could afford such expensive new homes in the first place. Here, the additional price increase only affects a narrow share of high- income households at the upper end of the income distribution, where affordability is already stretched.In contrast, metro areas, where new homes are more broadly affordable, experience a larger priced-out effect. A $1,000 increase in the median new home price affects a larger share of households in the “thicker part” of the income distribution. For example, in the Dallas-Fort Worth-Arlington, TX metro area, a $1,000 increase in new home price would disqualify 2,882 households from affording a median-priced new home. This is the largest priced-out effect among all metro areas, driven by the combination of relatively moderate home prices and a substantial population base. More details, including priced out estimates for every state and over 300 metropolitan areas, and a description of the underlying methodology, are available in the full study. Discover more from Eye On Housing Subscribe to get the latest posts sent to your email.

How Rising Costs Affect Home Affordability2025-03-10T09:19:44-05:00

Solid Job Gains in February

2025-03-07T11:16:44-06:00

The U.S. job market continued to grow at a solid pace in February, with the unemployment rate edging up slightly to 4.1%. The labor market remains healthy overall, but there are signs of potential weakness in the coming months, driven by mass federal government layoffs and ongoing policy uncertainty. This month’s jobs report may not fully reflect the impact of these layoffs in both the federal government and private sector, as the reference period for the monthly jobs report only covers the pay period that includes the 12th of the month. In fact, government job losses totaled only 10,000 workers for the February report. In February, wage growth accelerated. Year-over-year, wages grew at a 4.0% rate, down 0.1 percentage points from a year ago. Wage growth has been outpacing inflation for nearly two years, which typically occurs as productivity increases. National Employment According to the Employment Situation Summary reported by the Bureau of Labor Statistics (BLS), total nonfarm payroll employment rose by 151,000 in February, following a downwardly revised increase of 125,000 jobs in January. Since January 2021, the U.S. job market has added jobs for 50 consecutive months, making it the third-longest period of employment expansion on record. The estimates for the previous two months were revised. The monthly change in total nonfarm payroll employment for December was revised up by 16,000 from +307,000 to +323,000, while the change for January was revised down by 18,000 from +143,000 to +125,000. Combined, the revisions were 2,000 lower than previously reported. The unemployment rate rose to 4.1% in February. While the number of employed persons decreased by 588,000, the number of unemployed persons increased by 203,000. Meanwhile, the labor force participation rate—the proportion of the population either looking for a job or already holding a job—decreased two percentage points to 62.4%. For people aged between 25 and 54, the participation rate remained unchanged, at 83.5%. While the overall labor force participation rate remains below its pre-pandemic levels of 63.3% at the beginning of 2020, the rate for people aged between 25 and 54 exceeds the pre-pandemic level of 83.1%. In February, employment rose in several sectors, including health care (+52,000), financial activities (+21,000), transportation and warehousing (+18,000), and social assistance (+11,000). However, within the government sector, federal government employment saw a decline of 10,000, marking the worst month of federal government net hiring since June 2022. Construction Employment Employment in the overall construction sector increased by 19,000 in February, after a 2,000 gain in January. While residential construction gained 12,700 jobs, non-residential construction employment added 6,200 jobs for the month. Residential construction employment now stands at 3.4 million in February, broken down as 955,000 builders and 2.4 million residential specialty trade contractors. The 6-month moving average of job gains for residential construction was 2,600 a month. Over the last 12 months, home builders and remodelers added 50,500 jobs on a net basis. Since the low point following the Great Recession, residential construction has gained 1,387,000 positions. In February, the unemployment rate for construction workers rose to 5.3% on a seasonally adjusted basis. The unemployment rate for construction workers has remained at a relatively lower level, after reaching 15.3% in April 2020 due to the housing demand impact of the COVID-19 pandemic. Discover more from Eye On Housing Subscribe to get the latest posts sent to your email.

Solid Job Gains in February2025-03-07T11:16:44-06:00

Refinancing Drives Mortgage Activity Higher in February

2025-03-07T10:17:45-06:00

The Market Composite Index, a measure of mortgage loan application volume from the Mortgage Bankers Association’s (MBA) weekly survey, rose 4.7% month-over-month on a seasonally adjusted (SA) basis, primarily driven by refinancing activity. Compared to February last year, the index is 15.6% higher. The Purchase Index declined 6.5% (SA) from the previous month, though it may rebound as mortgage rates continue to fall amid weakening consumer sentiment and growing economic concerns. Meanwhile, the Refinance Index surged 22.7% (SA). Compared to February last year, purchase applications are marginally higher by 2.1%, while refinance activity has jumped 43.7%. The average 30-year fixed rate mortgage reported in the MBA survey for February fell 15 basis points (bps) to 6.9% (index level 687), 7 bps lower than a year ago. Loan sizes also increased with the average total market loan size (purchases and refinances combined) rising by 4.4% on a non-seasonally adjusted (NSA) basis from January to $389,500. For purchase loans, the average size increased by 3.93% to $446,000, while refinance loans experienced a 6.1% increase, reaching an average of $305,800. Adjustable-rate mortgages (ARMs) saw a jump in average loan size of 5.9% from $1.07 million to $1.13 million. Discover more from Eye On Housing Subscribe to get the latest posts sent to your email.

Refinancing Drives Mortgage Activity Higher in February2025-03-07T10:17:45-06:00

House Price Appreciation by State and Metro Area: Fourth Quarter 2024

2025-03-05T13:15:53-06:00

Following two straight quarters of deceleration, house price appreciation accelerated slightly in the fourth quarter of 2024 due to the persistent high mortgage rates and low inventory. Although inventories of existing homes have improved from a year ago, the current 3.5-month supply remains below the 4.5- to 6-month supply that considered a balanced housing market. Nationally, according to the quarterly all-transactions House Price Index (HPI) released by the Federal Housing Finance Agency (FHFA), U.S. house prices rose 5.4% in the fourth quarter of 2024, compared to the fourth quarter of 2023. The year-over-year rate has decreased from a high of 20.6% in the second quarter of 2022, but is higher than the previous quarter’s rate of 5.2%. The quarterly FHFA HPI not only reports house prices at the national level but also provides insights about house price fluctuations at the state and metro area levels. The FHFA HPI used in this article is the all-transactions index, measuring average price changes in repeat sales or refinancings on the same single-family properties.   Between the fourth quarter of 2023 and the fourth quarter of 2024, 49 states and the District of Columbia had positive house price appreciation. Vermont topped the house price appreciation list with an 8.9% gain, followed by New Jersey and Connecticut both with 8.3% gains. At the other end, Louisiana had the lowest house price appreciation (+2.1%), while Hawaii was the only state to experience a price decline (-4.3%). Among all 50 states and the District of Columbia, 31 states reached or exceeded the national growth rate of 5.4%. Compared to the third quarter of 2024, 32 out of the 50 states had an acceleration in house price appreciation in the fourth quarter. House price growth widely varied across U.S. metro areas year-over-year, ranging from -4.9% to +24.7%. In the fourth quarter of 2024, 18 metro areas, in reddish color on the map above, had negative house price appreciation, while the remaining 366 metro areas experienced positive price appreciation. Punta Gorda, FL had the largest decline in house prices, while Cumberland, MD-WV saw the highest increase over the previous four quarters. Additionally, house prices have increased dramatically since the COVID-19 pandemic. Nationally, house prices rose 53% between the first quarter of 2020 and the fourth quarter of 2024. More than half of metro areas saw house prices rise by more than the national price growth rate of 53%. The table below shows the top and bottom ten markets for house price appreciation between the first quarter of 2020 and the fourth quarter of 2024. Among all the metro areas, house price appreciation ranged from 11.2% to 87.8%. Ocean City, NJ experienced the highest house price appreciation. Lake Charles, LA had the lowest appreciation for the third quarter in a row. Discover more from Eye On Housing Subscribe to get the latest posts sent to your email.

House Price Appreciation by State and Metro Area: Fourth Quarter 20242025-03-05T13:15:53-06:00

About My Work

Phasellus non ante ac dui sagittis volutpat. Curabitur a quam nisl. Nam est elit, congue et quam id, laoreet consequat erat. Aenean porta placerat efficitur. Vestibulum et dictum massa, ac finibus turpis.

Recent Works

Recent Posts