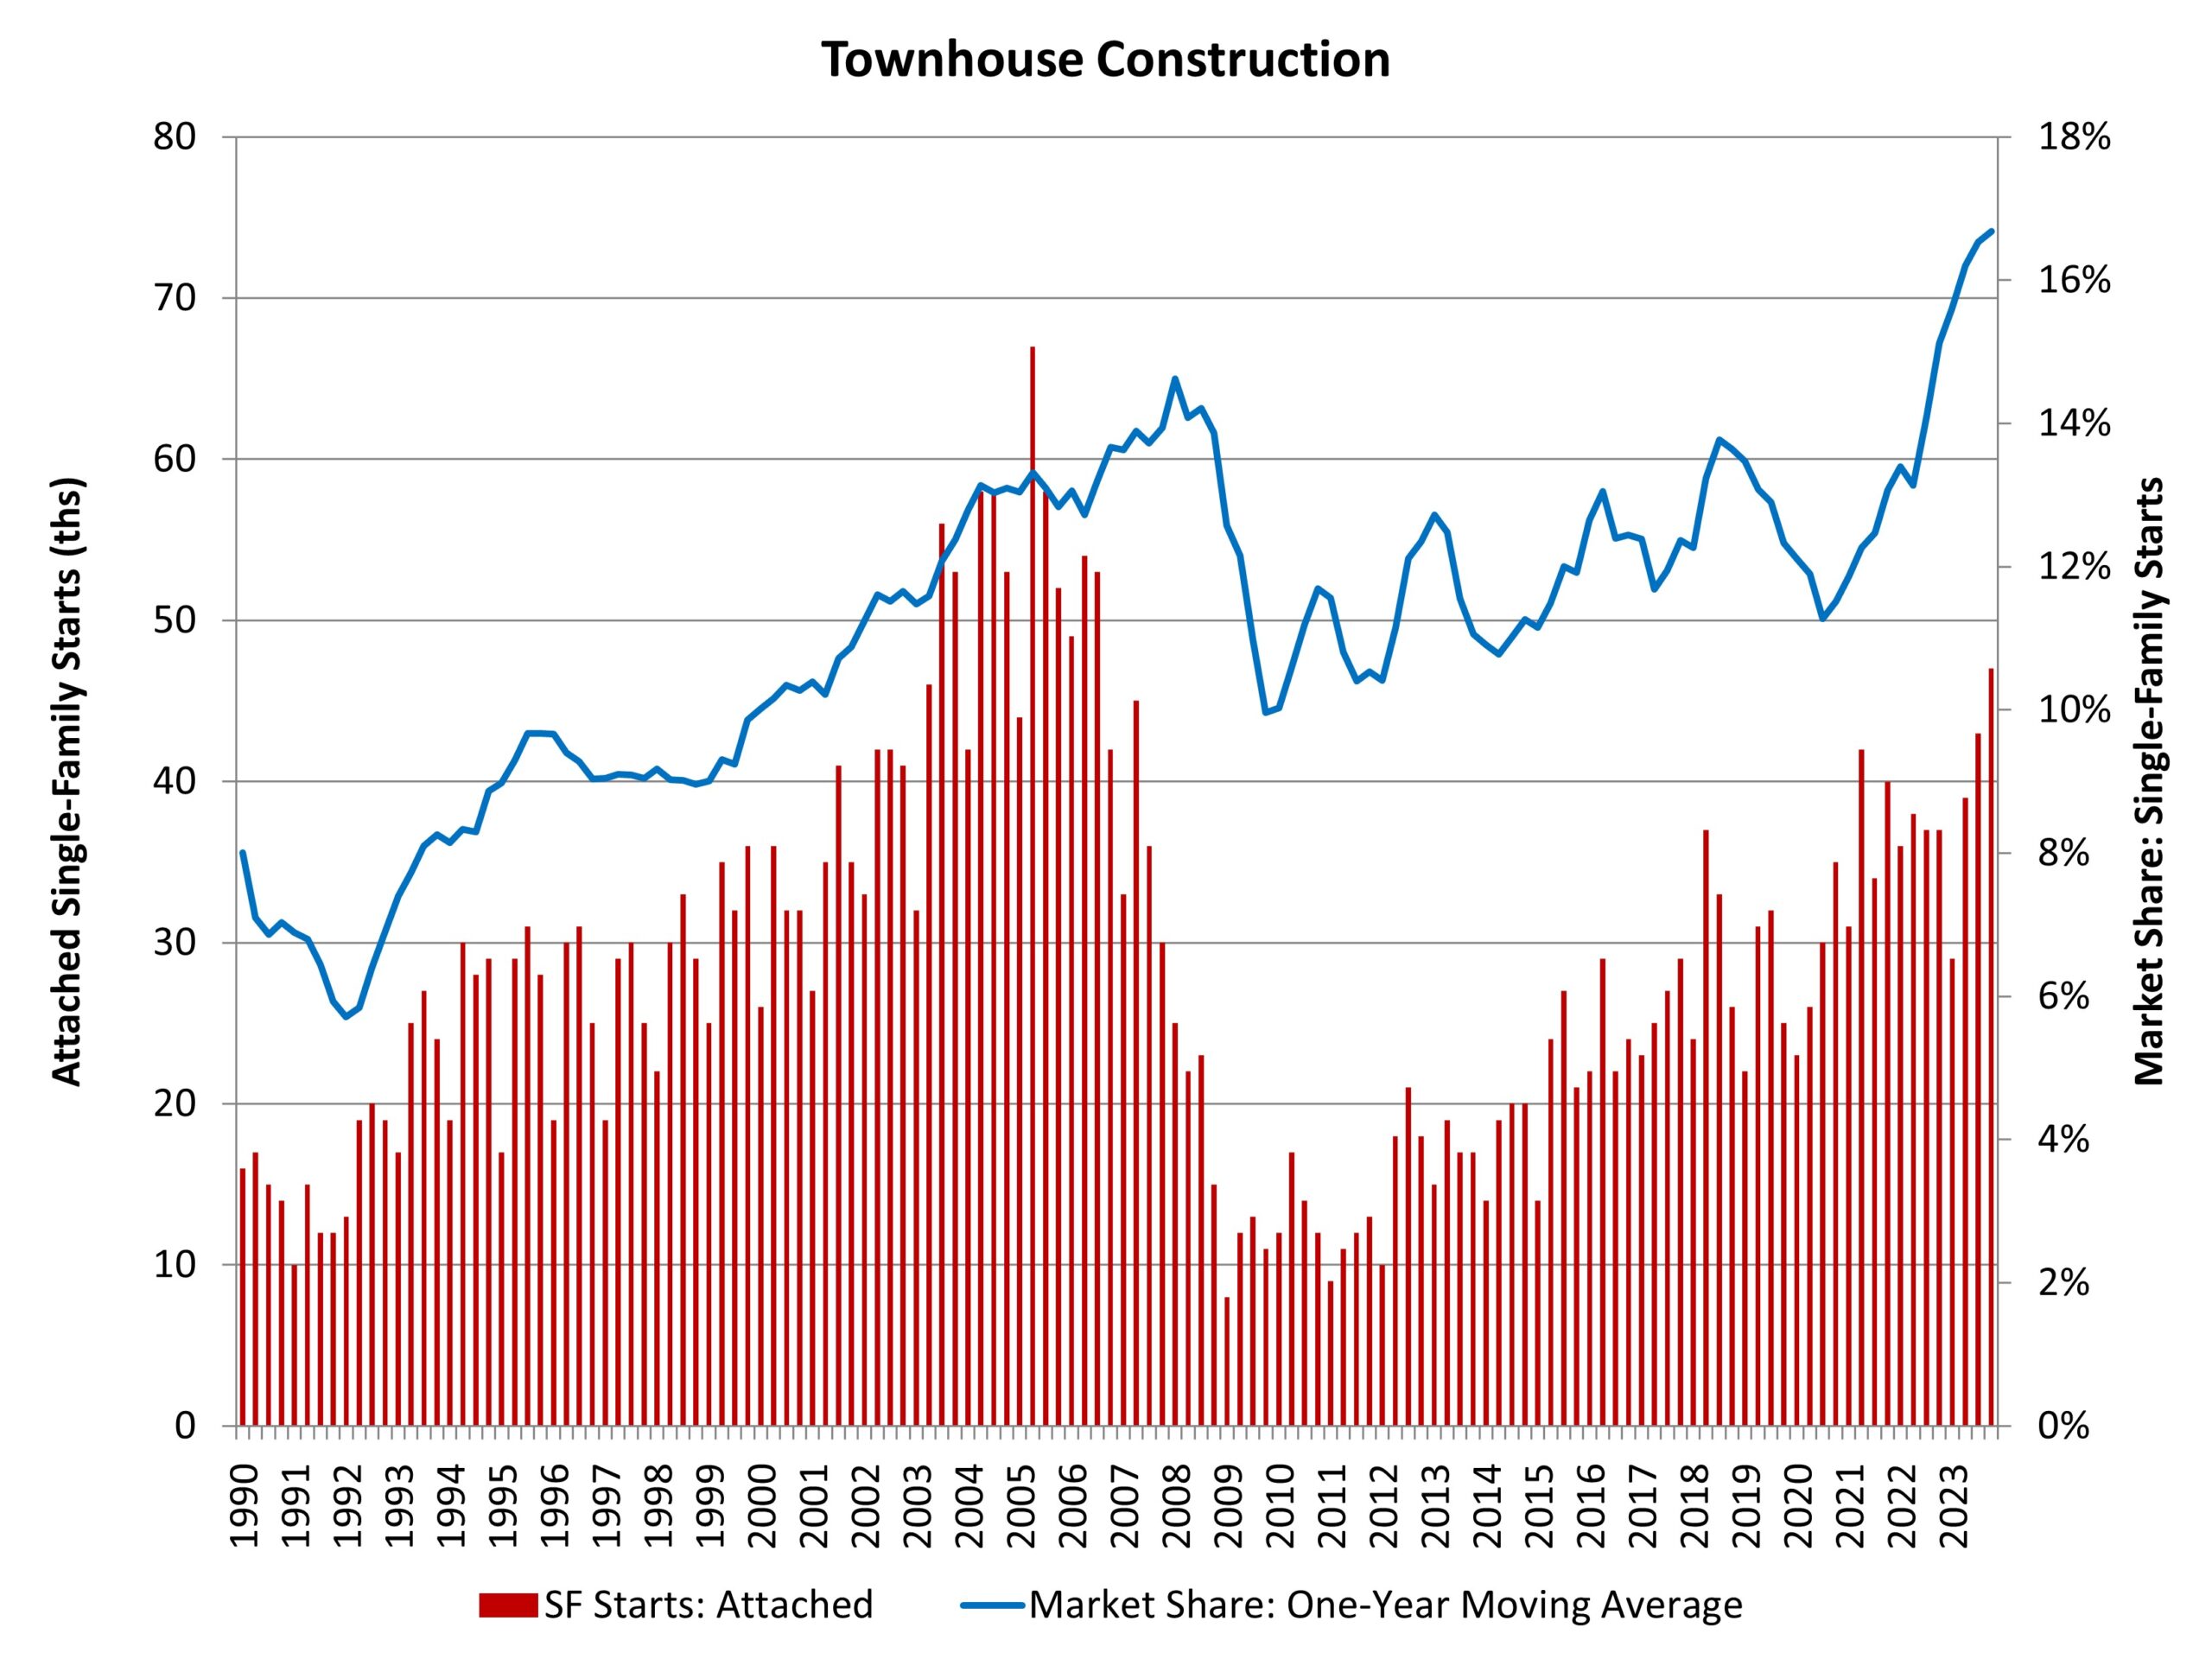
Residential Building Material Price Increase to Start 2024
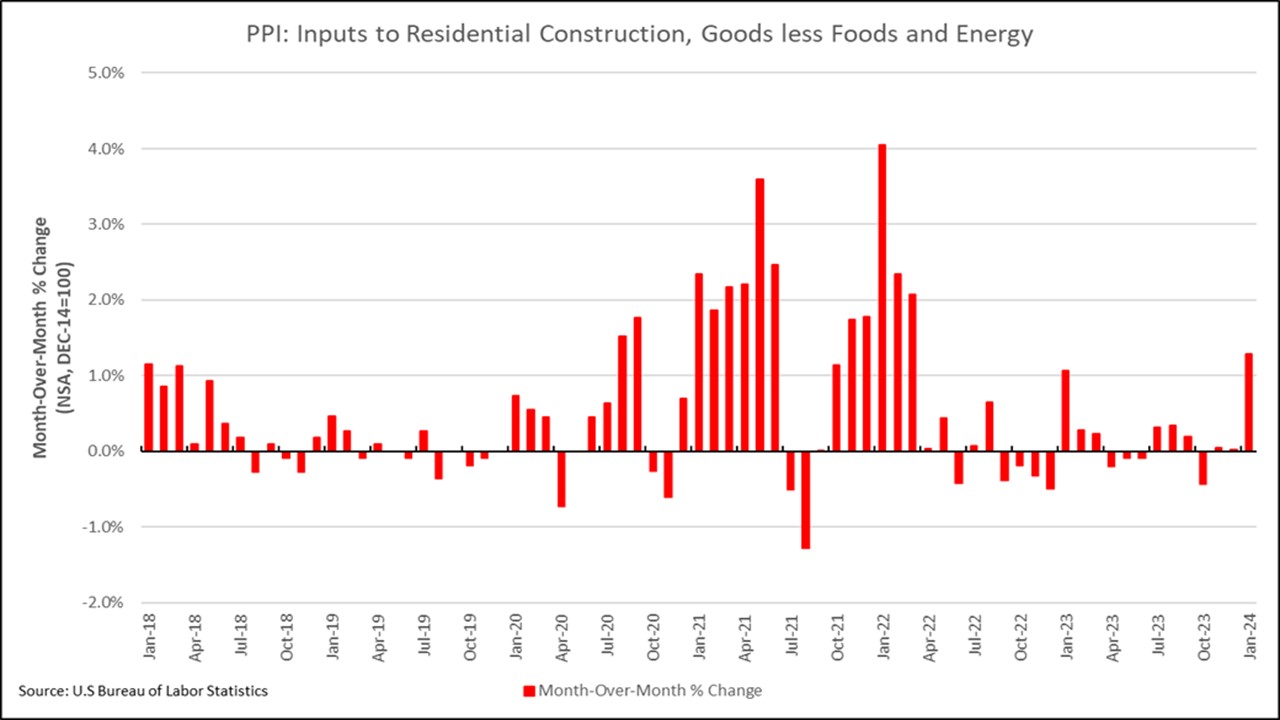
Jesse Wade2024-02-16T12:23:16-06:00By Jesse Wade on February 16, 2024 • The latest Producer Price Index, reported by U.S. Bureau of Labor Statistics, indicated that inputs to residential construction, goods less foods and energy (residential building materials, not seasonally adjusted) increased 1.28% between December 2023 and January 2024. This was the largest monthly change for the index since March of 2022, when it increased by 2.07%. The year-over-year change of the index was 1.91%, the largest yearly increase since February of 2023. The seasonally adjusted Producer Price Index for final demand goods decreased 0.2% in January, a fourth consecutive decrease for the index. The PPI for final demand energy decreased 1.7%, while final demand goods less foods and energy increased 0.3% in January. On a yearly basis, between January 2023 and 2024, the PPI for final demand goods was down 1.7%, with final demand energy down 9.8%, and final demand goods less foods and energy up 1.6%. The seasonally adjusted PPI for softwood lumber continued to fall as it decreased for the 6th consecutive month, down 1.82% in January. Over the past year, softwood lumber prices have been down 8.98%. Earlier this month, the U.S. Department of Commerce signaled plans to increase tariffs on Canadian softwood lumber from 8.05% to 13.86% this summer or early fall. The not seasonally adjusted PPI for gypsum building materials did not change over the month of January, but was 1.92% lower than last year. Ready-mix concrete seasonally adjusted prices increased in January 1.37% after falling 1.27% in December. On a yearly basis, ready-mix concrete was up 6.88% from January 2023. The not seasonally adjusted PPI for steel mill products continued to rise for the second straight month, up 5.4% in January. Over the year, steel mill products are up 4.39%. ‹ Best Quarter for Townhouse Construction Since 2006Tags: construction costs, inflation, lumber prices, ppi, producer price index, producer prices, ready-mix concrete, softwood lumber, steel