At 2022 Rates, 10 Million More Households Could Afford a New Home
Paul Emrath
May 8, 2024
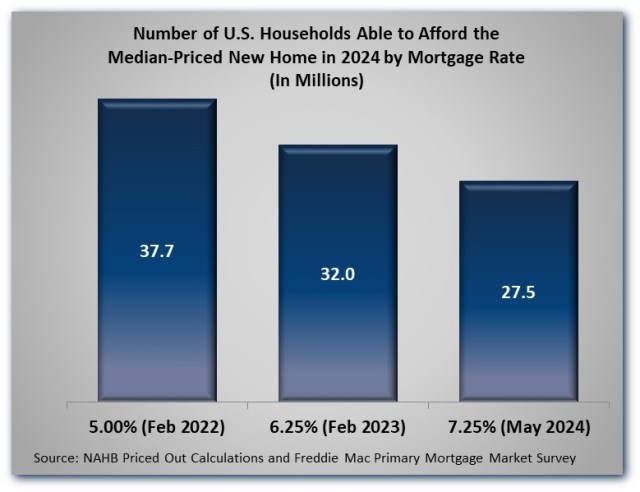
According to the latest press release from Freddie Mac, the average rate on a 30-year fixed-rate mortgage has now risen to approximately 7.25%. As the data posted on NAHB’s priced-out web page shows, at this rate only about 27.5 million (out of a total of 134.7 million) U.S. households could afford to buy a median-priced new home, based on their incomes and standard underwriting criteria.
For context, consider that the last time the average mortgage rate was under 6.25% was in mid-February of 2023. If that interest rate prevailed now, 4.5 million more households (for a total of 32.0 million) could afford the median new home. A year further back, prior to mid-February of 2022, the average mortgage rate was consistently under 5.00%. At a rate of 5.00%, 37.7 million households could afford the median new home. In short,10.2 million U.S. households are currently being priced out of the market by the average mortgage rate sitting 225 basis points higher than it was in February 2022.
A recent post, How Rising Costs Affect Home Affordability, showed how many households are priced out of the market by a $1,000 increase in the price of the median new home. The analysis is based on the standard underwriting criterion that the sum of mortgage payments (principal and interest), property taxes, homeowners and private mortgage insurance premiums (PITI) during the first year should be no more than 28 percent of the home buyer’s income. The advantage of this methodology is that it requires only a starting house price, household income distribution, and characteristics of the typical mortgage. A household income distribution is available for virtually any part of the country from the Census Bureau’s American Community Survey. Typical mortgage characteristics and other details are discussed both in NAHB’s April 1 Special Study and on the priced-out web page.
This same methodology can be used to determine the number of U.S. household priced out of the market by a change in interest rates, rather than house prices. Results of these calculations are reproduced from the special study and web page in the table below:
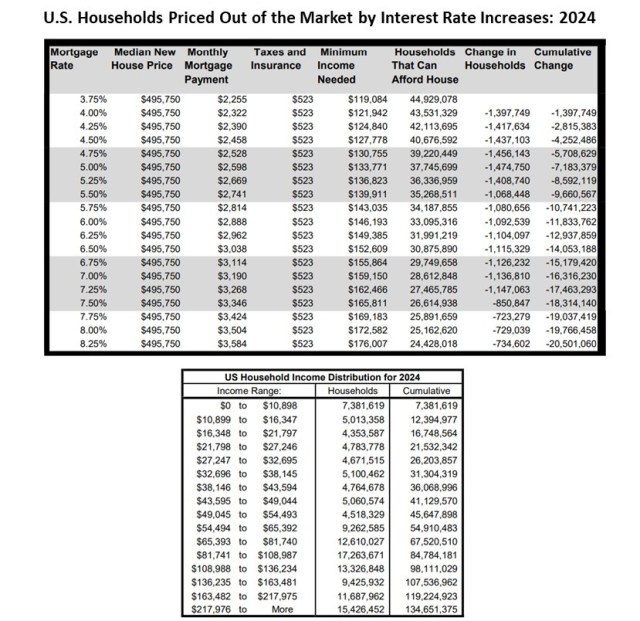
Finding the impact of a change in the mortgage rate (in either direction) from this table is relatively straightforward. For example, the 7.25%-mortgage-rate row shows approximately 27.5 million households able to afford the median-priced new home. If the rate fell back to 6.25%, the table shows an additional 4.5 million (for a total of approximately 32.0 million) households would be priced into the market.
This change is particularly relevant, as NAHB is currently projecting that the average mortgage rate will be near 6.25% by the end of 2024—although there is considerable uncertainty around this number, due largely to uncertainty about what monetary policy the Federal Reserve will find necessary to contain inflation. Readers can refer back to the above table to track the impact actual changes in mortgage rates are having on affordability of new homes over the rest of the year.
As many analysts have noted, interest rates and house prices interact with each other to determine new home affordability. For example, if the costs of producing homes and the resulting prices to buyers were reduced (for instance, by adopting some of the measures in NAHB’s 10-point plan to lower shelter inflation), more than 4.5 million households would be priced into the market by reducing interest rates from 7.25% to 6.25%.
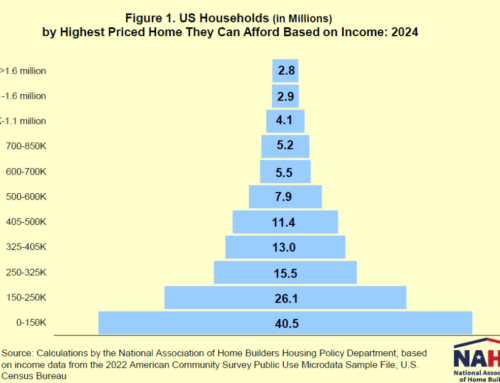
Similarly, if interest rates were lower, a larger number of households would be priced into the market by a given reduction in house prices. This occurs because at lower prices or interest rates, the starting point is in a denser part of the U.S. income distribution, where there are more households to be priced into (or out of) the market. This point will be illustrated graphically in a forthcoming post on NAHB’s 2024 housing affordability pyramid.
Discover more from Eye On Housing
Subscribe to get the latest posts to your email.