Multifamily Missing Middle Construction Unchanged
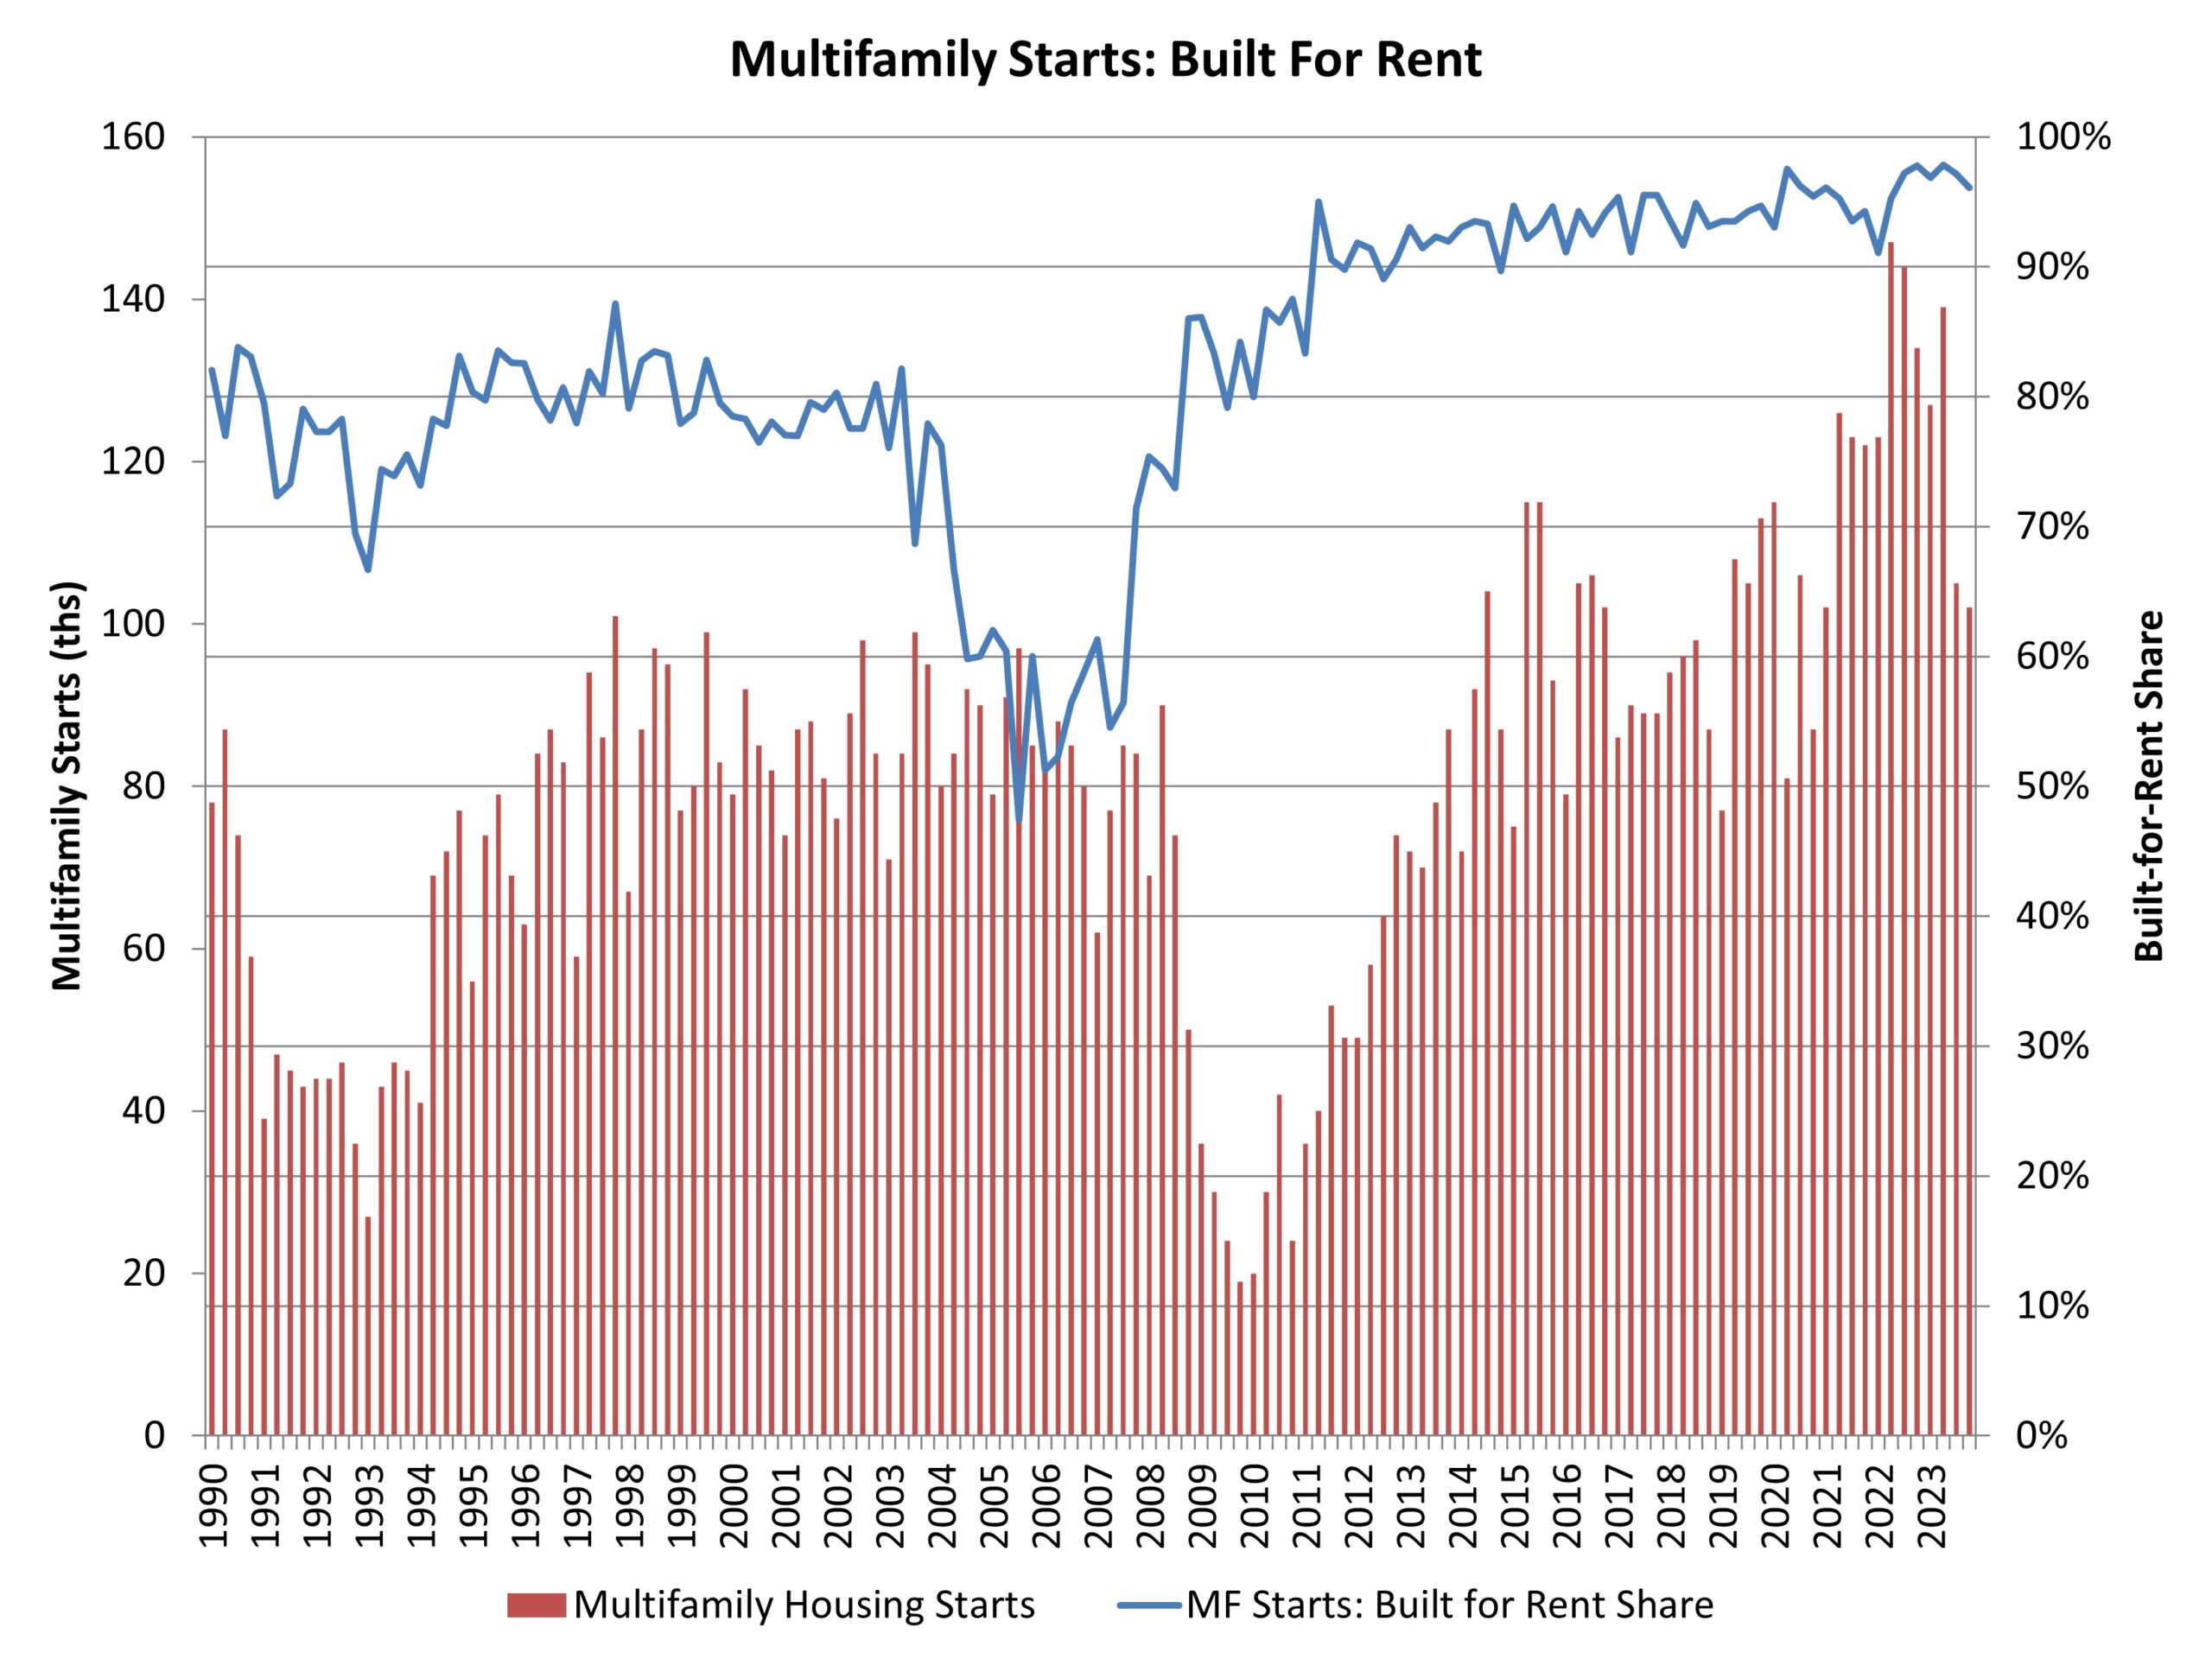
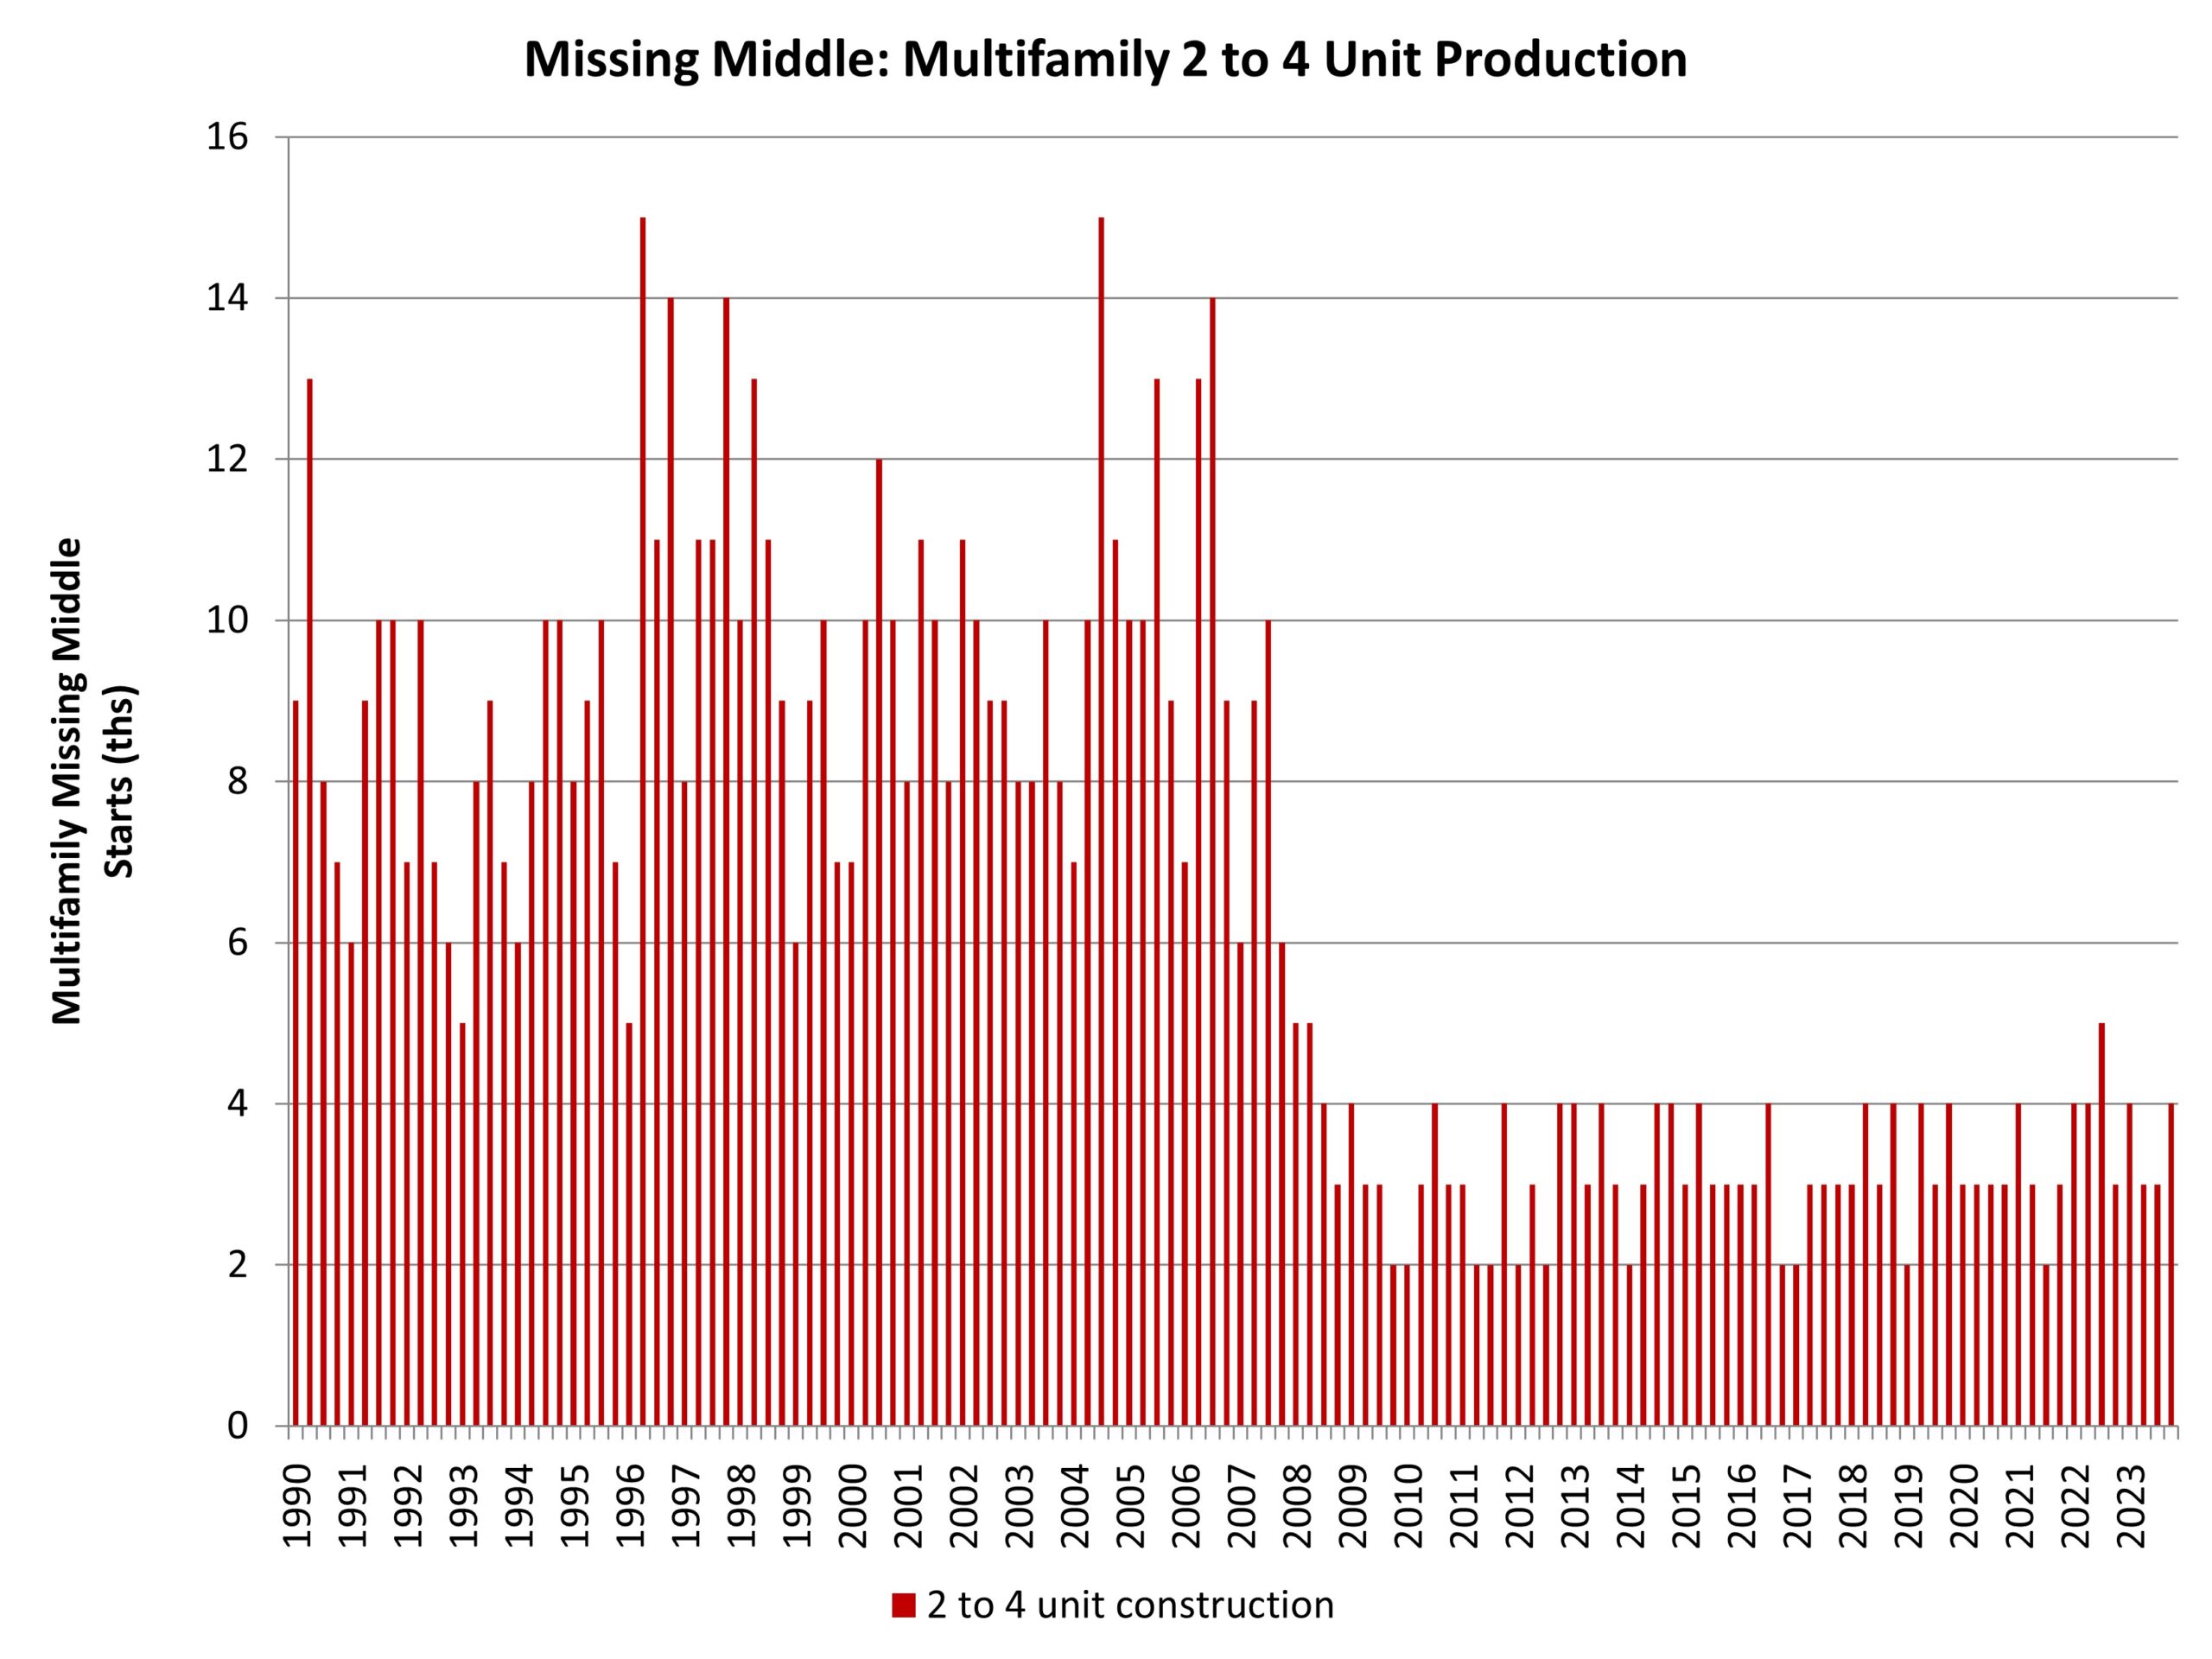
Robert Dietz2024-02-23T08:15:28-06:00By Robert Dietz on February 23, 2024 • The missing middle construction sector includes development of medium-density housing, such as townhouses, duplexes and other small multifamily properties. The multifamily segment of the missing middle (apartments in 2- to 4-unit properties) has disappointed since the Great Recession. For the fourth quarter of 2023, there were just 4,000 2- to 4-unit housing unit construction starts. This is flat from a year prior. As a share of all multifamily production, 2- to 4-unit development was just above 4% of the total for the fourth quarter. In contrast, from 2000 to 2010, such home construction made up a little less than 11% of total multifamily construction. Construction of the missing middle has clearly lagged during the post-Great Recession period and will continue to do so without zoning reform focused on light-touch density. ‹ Multifamily Developer Confidence in Negative Territory in Fourth QuarterTags: missing middle, multifamily, starts