Existing Home Sales Surge to One-Year High in February

2024-03-21T13:23:20-05:00

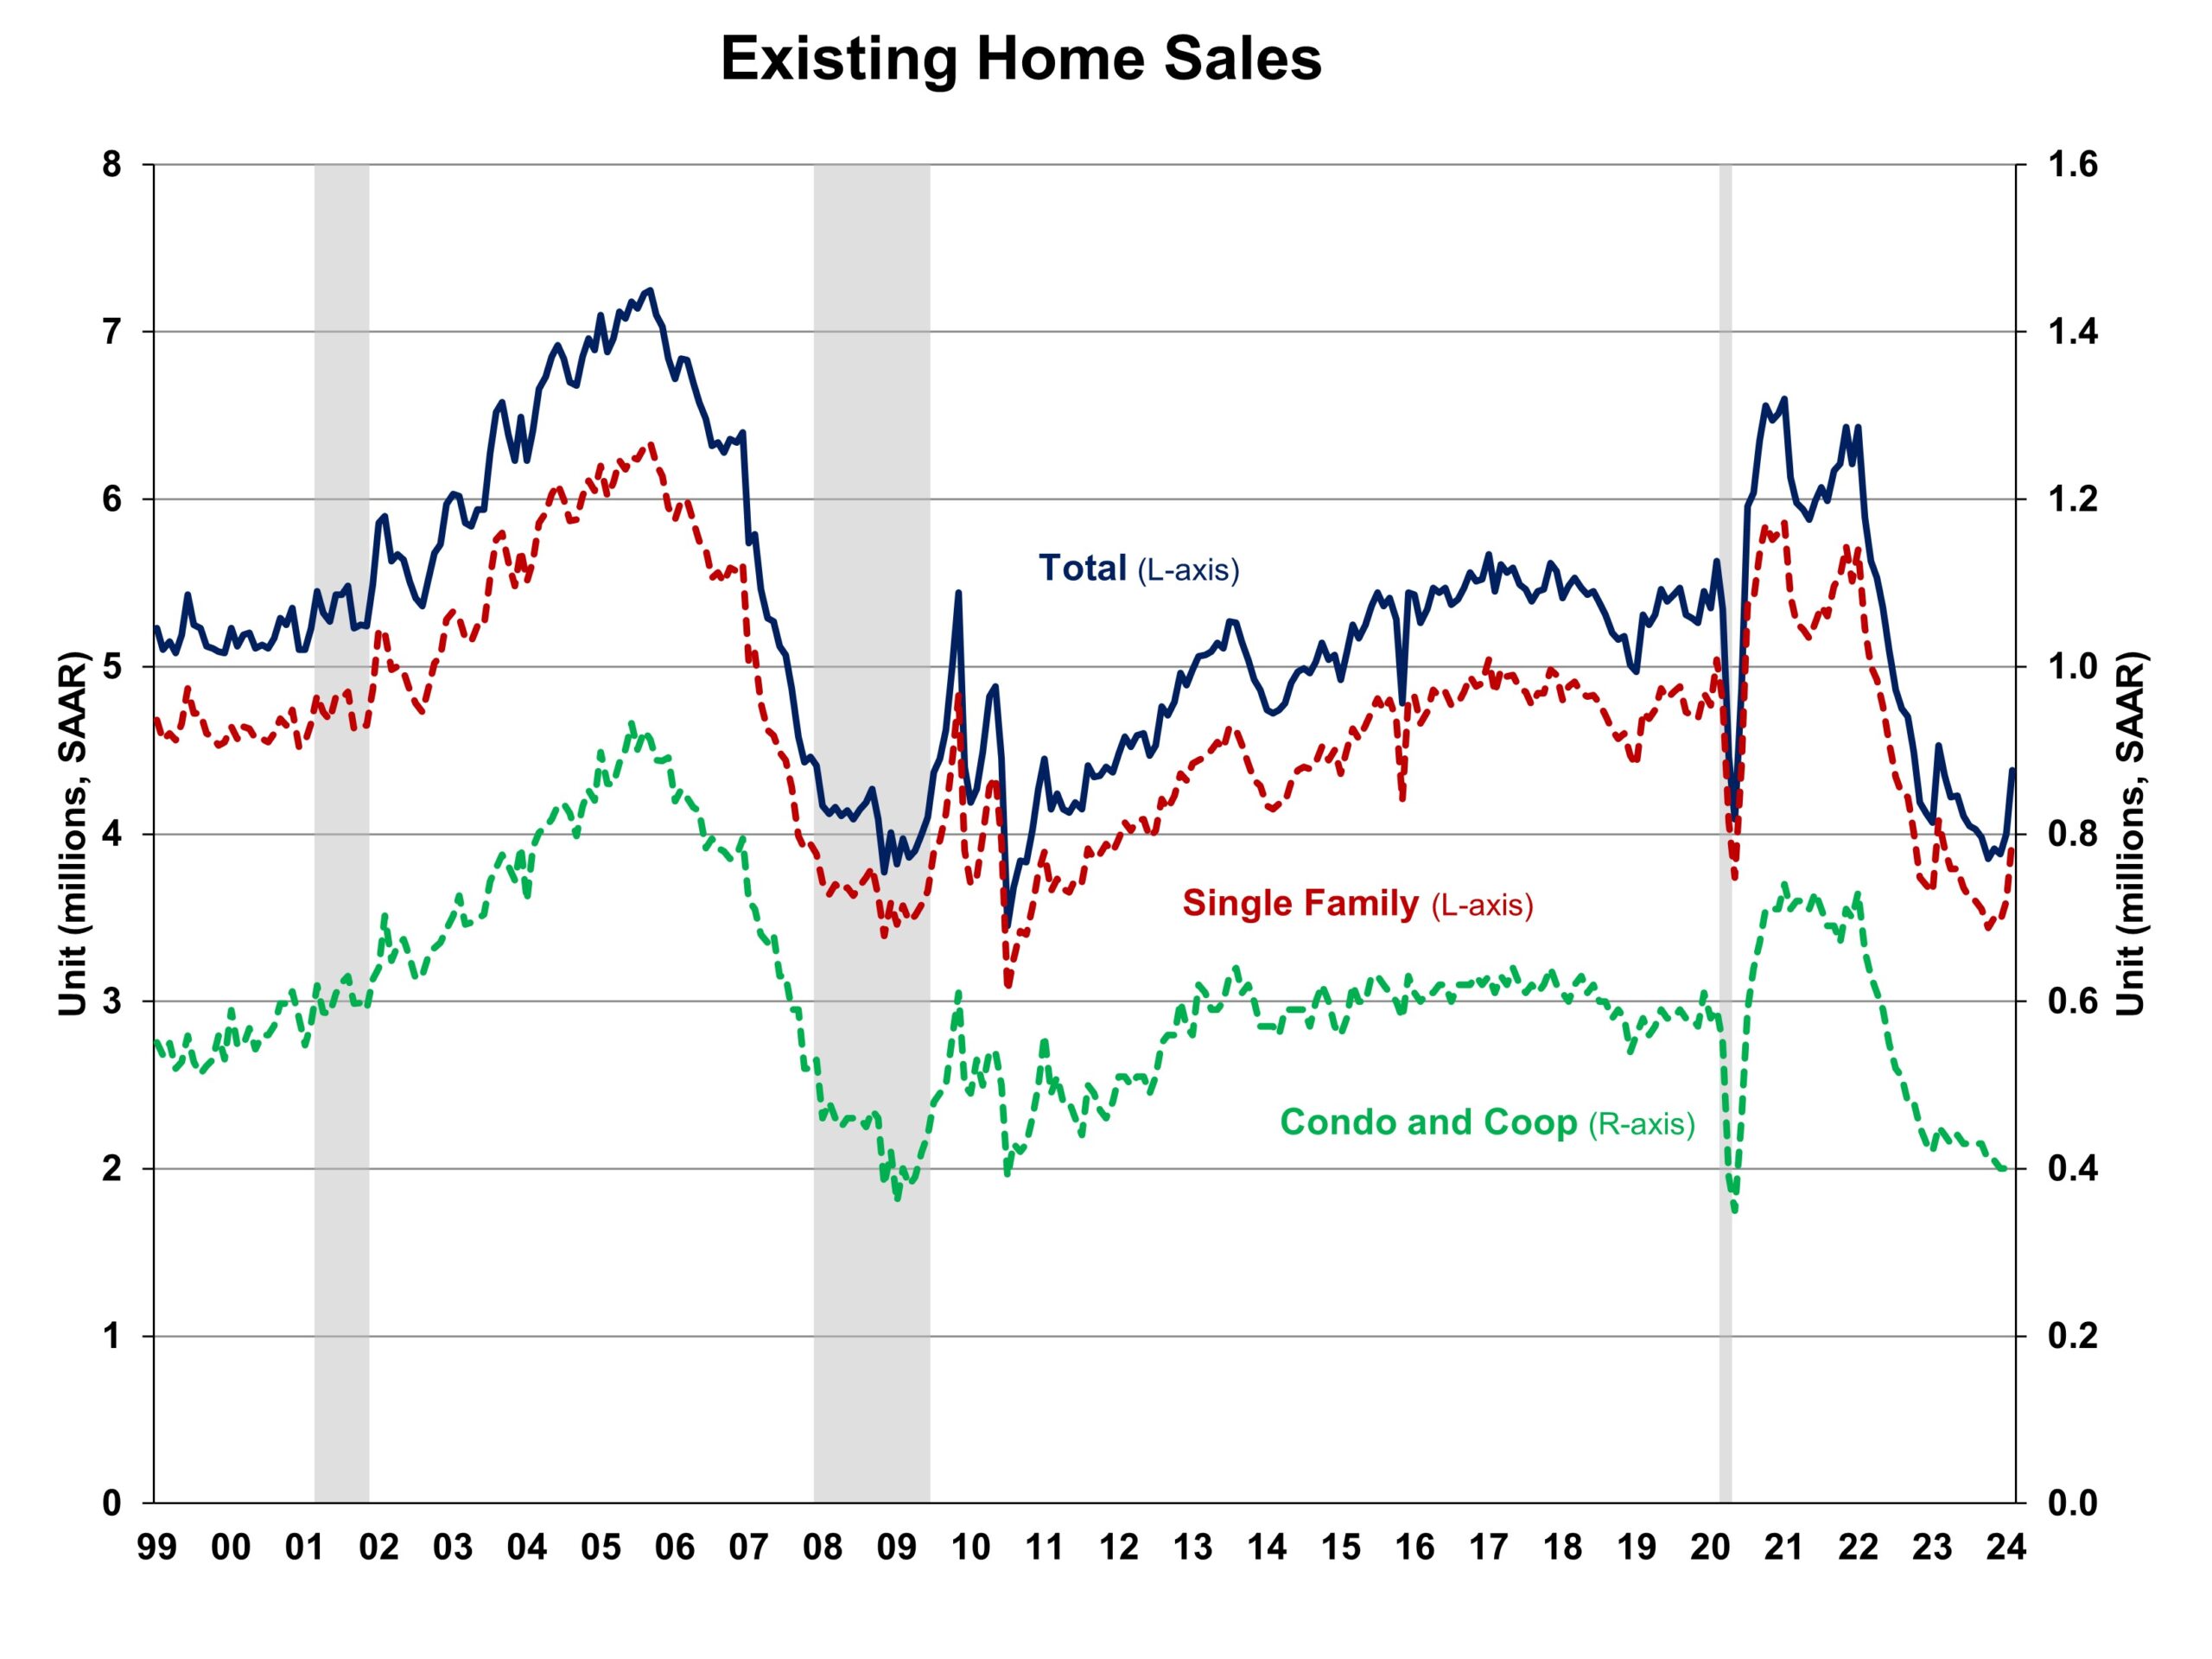
Despite the rising mortgage rates witnessed in February, existing home sales continued to improve and climbed to a 12-month high, according to the National Association of Realtors (NAR). However, low resale inventory and strong demand continued to drive up existing home prices, marking the eighth consecutive month of year-over-year median sales price increases. Recent declines in mortgage rates and a continued improvement in inventory are expected to drive more demand in the coming months. Total existing home sales, including single-family homes, townhomes, condominiums, and co-ops, rose 9.5% to a seasonally adjusted annual rate of 4.38 million in February (as shown below). However, on a year-over-year basis, sales were 3.3% lower than a year ago. The first-time buyer share fell to 26% in February, down from 28% in January 2023 and from 27% in February 2023. The inventory level rose from 1.01 million in January to 1.07 million units in February and is up 10.3% from a year ago. At the current sales rate, February unsold inventory sits at a 2.9-months supply, down from 3.0-months last month but up from 2.6 months a year ago. This inventory level remains very low compared to balanced market conditions (4.5 to 6 months’ supply) and illustrates the long-run need for more home construction. Homes stayed on the market for an average of 38 days in February, up from 36 days in January and 34 days in February 2023. The February all-cash sales share was 33% of transactions, up from 32% in January and 28% a year ago. All-cash buyers are less affected by changes in interest rates. The February median sales price of all existing homes was $384,500, up 5.7% from last year. This marked the highest recorded price for the month of February. The median condominium/co-op price in February was up 6.7% from a year ago at $344,000. Existing home sales in February were mixed across the four major regions (as shown below). Sales in the Midwest, South, and West increased 8.4%, 9.8%, and 16.4% in February, while sales in the Northeast remained unchanged. On a year-over-year basis, all four regions saw a decline in sales, ranging from -1.2% in the West to -7.7% in the Northeast. The Pending Home Sales Index (PHSI) is a forward-looking indicator based on signed contracts. The PHSI fell from 78.1 to 74.3 in January. On a year-over-year basis, pending sales were 8.8% lower than a year ago per the NAR data.

Existing Home Sales Surge to One-Year High in February2024-03-21T13:23:20-05:00

Fed Holds Steady, Sees Stronger Growth

2024-03-20T14:16:34-05:00

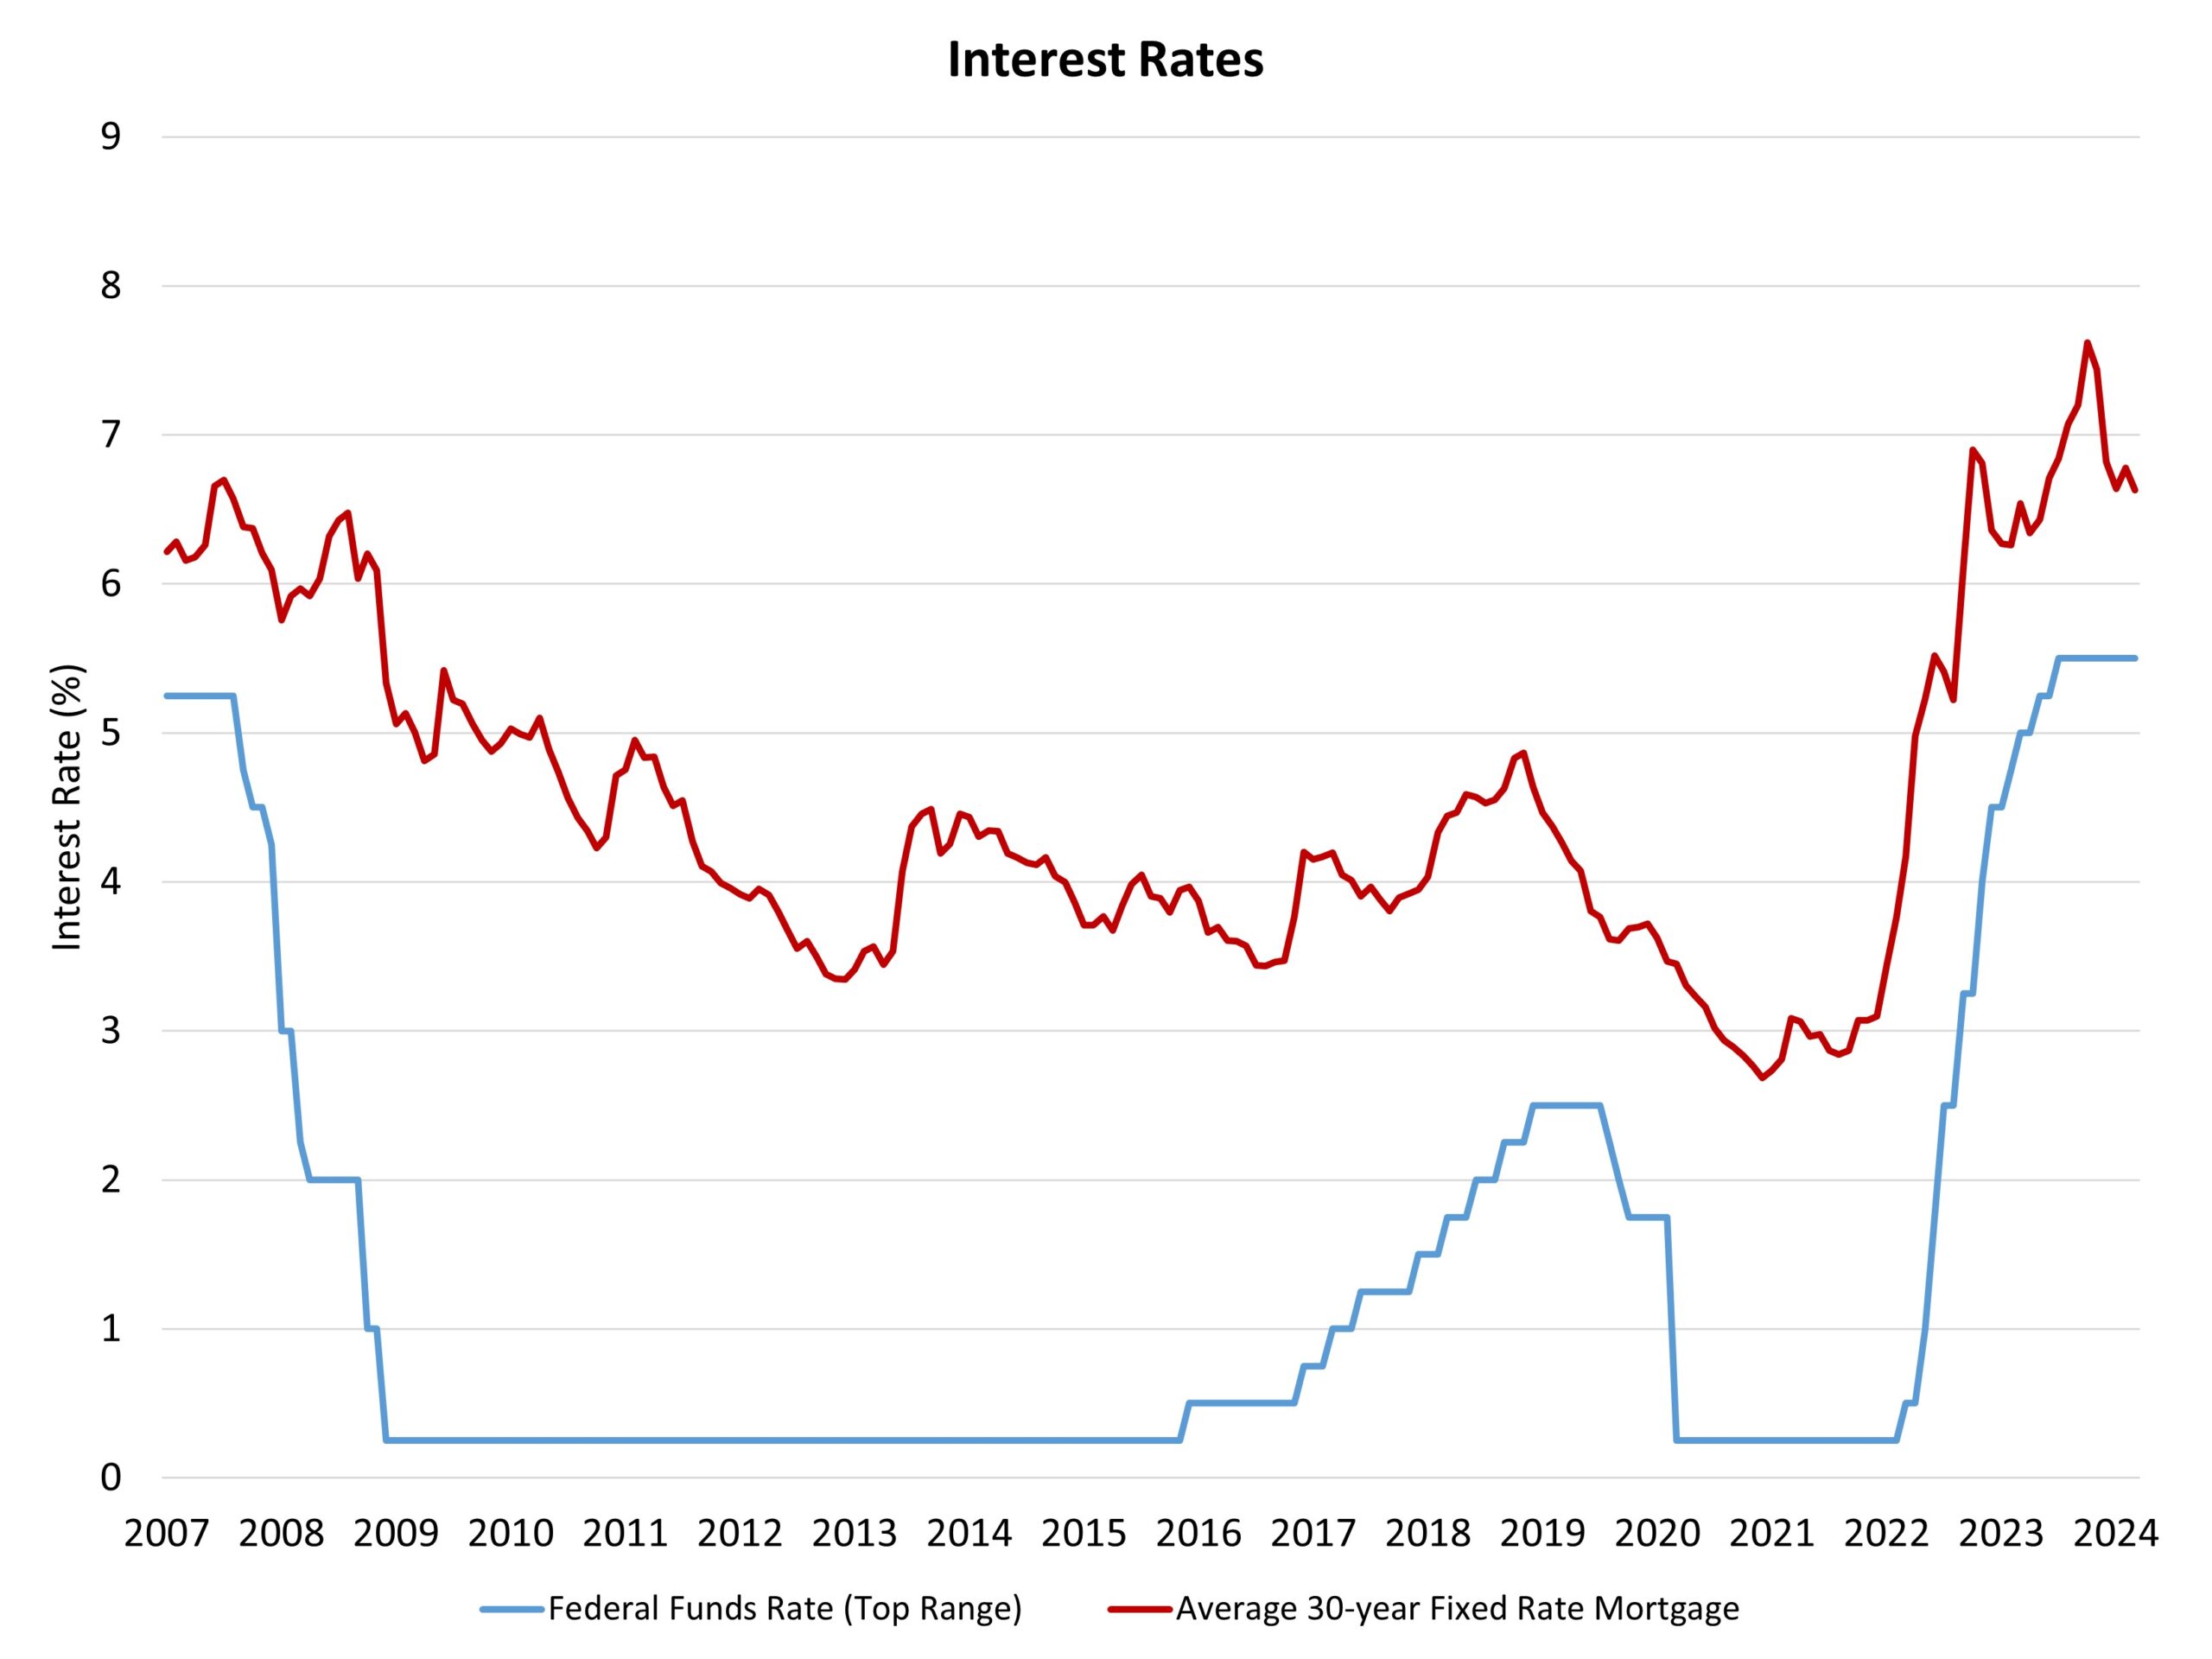
The Federal Reserve’s monetary policy committee held the federal funds rate constant at a top target of 5.5% at the conclusion of its March meeting. The Fed will continue to reduce its balance sheet holdings of Treasuries and mortgage-backed securities as part of quantitative tightening and balance sheet normalization. Marking a fifth consecutive meeting holding the federal funds rate constant, the Fed continues to set the ground for rate cuts later in 2024. With inflation data moderating (albeit at a slower pace) and economic growth coming in better than forecast, the Fed’s future expectations for rate cuts stands at three (25 basis point cuts) in the central bank’s forecast for 2024. NAHB’s forecast continues to call for just two rate cuts during the second half of 2024 due to lingering inflation pressure and solid GDP growth conditions. Nonetheless, an ultimately lower federal funds rate will reduce the cost of builder and developer loans and help moderate mortgage rates headed into 2025. The Fed made several upgrades to its economic outlook for the March report. The forecast for 2024 GDP growth increased from 1.4% to 2.1%. The Fed also increased its more theoretical long-run growth estimate for the economy from 2.5% to 2.6%. This suggests that the economy is more capable than previously estimated of handling higher interest rates in the years ahead (this is a measure of the so-called “neutral rate”). All in, there was not a lot new for the March decision reporting. Markets and forecasters expected no change for Fed policy today. And equity and bond markets had already priced in expectations of stronger than expected growth via higher stock prices and a 10-year Treasury rate holding near 4.3%, a gain of more than 30 basis points since the start of the year despite forecasts for gradual declines by the end of 2024. The NAHB Economics team’s focus continues to be on the interplay between Fed monetary policy and the shelter/housing inflation component of overall inflation. With more than half of the overall gains for consumer inflation due to shelter over the last year, increasing attainable housing supply is a key anti-inflationary strategy, one that is complicated by higher short-term rates, which increase builder financing costs and hinder home construction activity. For these reasons, policy action in other areas, such as zoning reform and streamlining permitting, can be important ways for other elements of the government to fight inflation.

Fed Holds Steady, Sees Stronger Growth2024-03-20T14:16:34-05:00

NAHB Releases What Home Buyers Really Want, Study Shows Buyers Want Smaller Homes

2024-03-20T08:18:56-05:00

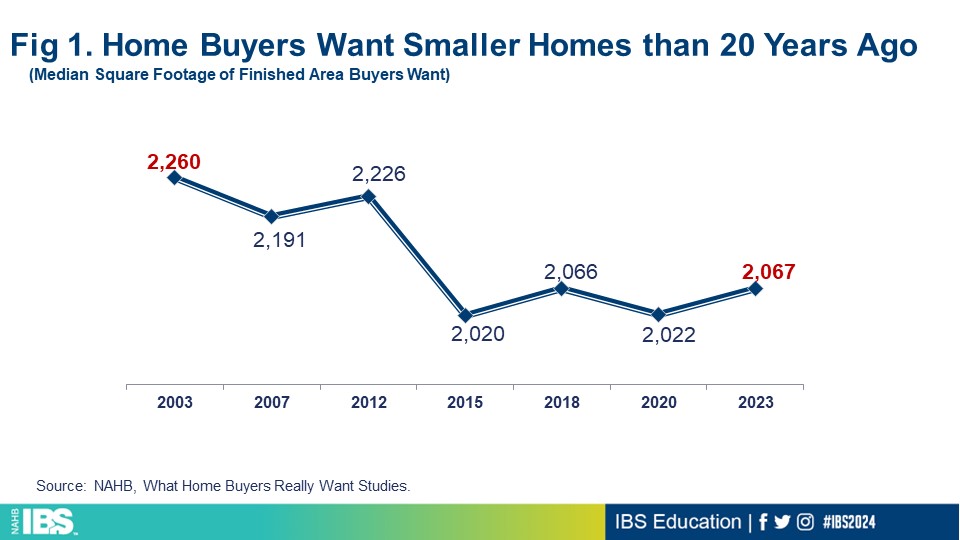
Continuing NAHB’s commitment to be at the forefront of research on home buyer preferences, the 2024 edition of What Home Buyers Really Want was recently released at the International Builders’ Show. The primary objective of the study is to provide builders, manufacturers, architects, and the general residential construction industry with a thorough analysis of what buyers are looking for in their homes and communities.  Because of the inherent diversity in buyer backgrounds, the study provides granular specificity based on demographic factors such as generation, geographic location, race/ethnicity, income, and price point. The study reveals that buyers want smaller homes than they did 20 years ago.  In 2003, the typical home buyer wanted 2,260 square feet of finished area.  In 2023, that number was down to 2,067 square feet.  Figure 1 shows there has been a permanent downward shift in buyer preferences for home size.  From 2003 to 2012, the typical buyer wanted to buy a home ranging in size from 2,200 to 2,300 square feet.  Since 2015, that range dropped to between 2,000 and 2,100 square feet. Data from the U.S. Census Bureau on the size of new homes confirm they have been shrinking for nearly a decade.  The average size of new homes started in 2023 dropped to 2,411 square feet (the smallest in 13 years), continuing a downward trend that began in 2015 when average home size peaked at 2,689 square feet.  The only year that saw home size increase during this period was 2021, due to the pandemic-induced desire for additional space to work/study from home and the low interest-rate environment that allowed buyers to purchase those bigger homes.  But the decline in average home size resumed in both 2022 and 2023.  Importantly, the median size of new homes has also trended down for a decade, reaching 2,179 square feet in 2023. This is the first of a series of posts over the next few weeks that will cover the most important findings in the latest What Home Buyers Really Want, 2024 Edition.  The study is based on a national survey of more than 3,000 recent and prospective home buyers, selected to proportionally represent of the US population in terms of age, income, race/ethnicity, and region of the country.

NAHB Releases What Home Buyers Really Want, Study Shows Buyers Want Smaller Homes2024-03-20T08:18:56-05:00

States and Construction Trades Most Reliant on Immigrant Workers, 2022

2024-03-20T08:19:40-05:00

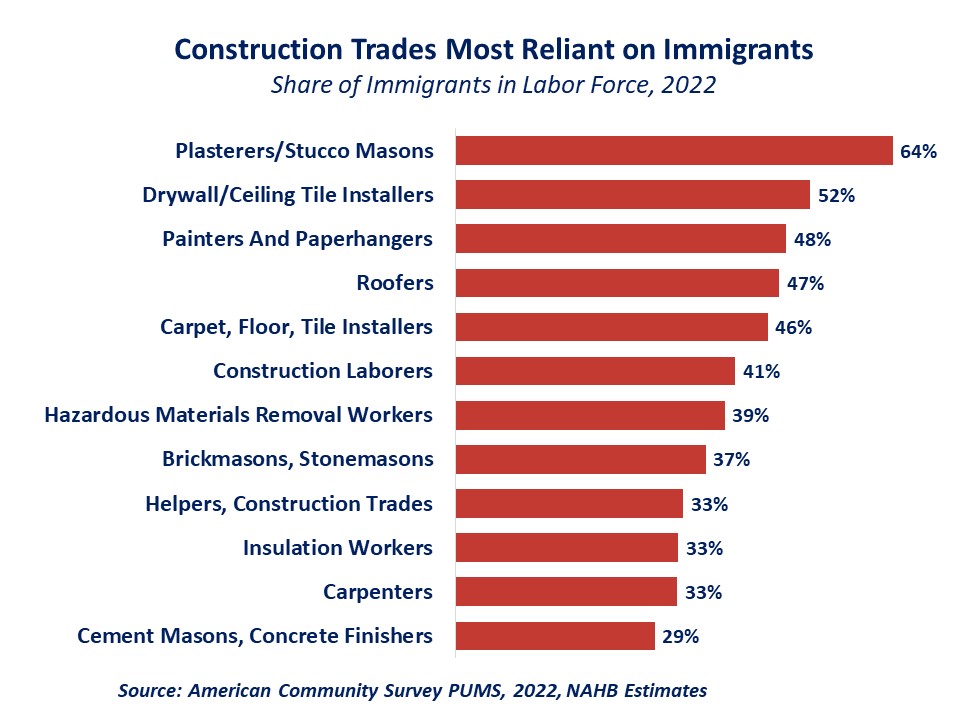
As we reported earlier, immigrants make one in four construction workers. The share is significantly higher (31%) among construction tradesmen. In some states, reliance on foreign-born labor is particularly evident, with immigrants comprising 40% of the construction workforce in California and Texas. Supported by a substantial increase in immigration to the United States since 2022, labor shortages in construction have eased but remain elevated. According to the government’s system for classifying occupations, the construction industry employs workers in about 380 occupations. Out of these, only 33 are construction trades, yet they account for almost two thirds of the construction labor force. The other one-third of workers are in finance, sales, administration and other off-site activities. The concentration of immigrants is particularly high in construction trades essential for home building, such as plasterers and stucco masons (64%), drywall/ceiling tile installers (52%), painters (48%), roofers (47%), carpet/floor/tile installers (46%). The two most prevalent construction occupations, laborers and carpenters, account for over a quarter of the construction labor force. A third of all carpenters and 41% of construction laborers are of foreign-born origin. These trades require less formal education but consistently register some of the highest labor shortages in the NAHB/Wells Fargo Housing Market Index (HMI) surveys and NAHB Remodeling Market Index (RMI). In the latest February 2024 HMI Survey, 65% of builders reported some or serious shortage of workers performing finished carpentry. Looking at other tradesmen directly employed by builders, the shortages of bricklayers and masons are similarly acute, despite a high presence of immigrant workers in these trades. Labor shortages are also high among electricians, plumbers and HVAC technicians, with over half of surveyed builders reporting shortages of these craftsmen. In contrast, these trades demand longer formal training, often require professional licenses and attract fewer immigrants.Reliance on foreign-born labor is quite uneven across the US states. Immigrants comprise close to 40% of the construction workforce in California and Texas. In Florida, 38% of the construction labor force is foreign-born. In New York and New Jersey, 37% of construction industry workers come from abroad. Construction immigrants are concentrated in a few populous states, with more than half of all immigrant construction workers (56%) residing in California, Texas, Florida, and New York. These are not only the most populous states in the U.S., but also particularly reliant on foreign-born construction labor. However, the reliance on foreign-born labor continues to spread outside of these traditional immigrant magnets. This is evident in states like New Jersey, Nevada, and Maryland where immigrants, as of 2022, account for over a third of the construction labor force. In Massachusetts, Connecticut, Georgia, Rhode Island, and Arizona, one out of four construction workers are foreign-born. At the other end of the spectrum, nine northern states have the share of immigrant workers below 5%. While most states draw the majority of immigrant foreign-born workers from the Americas, Hawaii relies more heavily on Asian immigrants. European immigrants are a significant source of construction labor in New York, New Jersey and Illinois.

States and Construction Trades Most Reliant on Immigrant Workers, 20222024-03-20T08:19:40-05:00

Moderating Interest Rates, Pent-up Demand Push Single-Family Starts Higher

2024-03-19T09:20:28-05:00

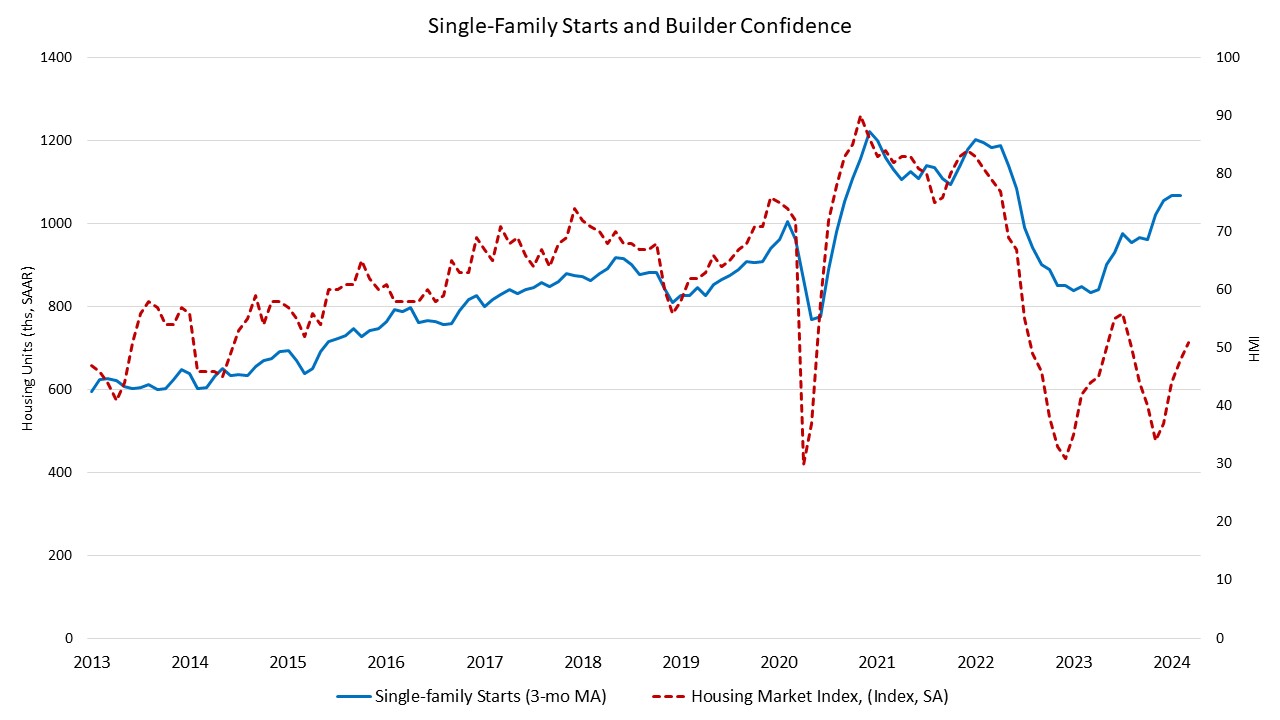
Pent-up demand, moderating interest rates, and a lack of existing inventory helped push single-family starts in February to their highest level since April 2022. Overall housing starts increased 10.7% in February to a seasonally adjusted annual rate of 1.52 million units, according to a report from the U.S. Department of Housing and Urban Development and the U.S. Census Bureau. The February reading of 1.52 million starts is the number of housing units builders would begin if development kept this pace for the next 12 months. Within this overall number, single-family starts increased 11.6% to a 1.13 million seasonally adjusted annual rate. Single-family starts are also up 35.2% compared to a year ago. The three-month moving average (a useful gauge given recent volatility) is up to over 1.0 million starts, as charted below. The multifamily sector, which includes apartment buildings and condos, increased 8.3% to an annualized 392,000 pace for 2+ unit construction in February. The three-month moving average for multifamily construction has been trending up to a 419,000-unit annual rate. On a year-over-year basis, multifamily construction is down 34.8%. On a regional basis compared to the previous month, combined single-family and multifamily starts are 10.3% lower in the Northeast, 50.7% higher in the Midwest, 15.7% higher in the South and 7.9% lower in the West. As an indicator of the economic impact of housing, there are now 683,000 single-family homes under construction; this is 6.1% lower than a year ago. Meanwhile, there are currently 983,000 apartment units under construction. This is up 2.5% compared to a year ago (959,000). Total housing units now under construction (single-family and multifamily combined) are 1.2% lower than a year ago. Overall permits increased 1.9% to a 1.52 million unit annualized rate in February and are up 2.4% compared to February 2023. Single-family permits increased 1.0% to a 1.03 million unit rate and are up 29.5% compared to the previous year. Multifamily permits increased 4.1% to an annualized 487,000 pace but multifamily permits are down 29.0% compared to February 2023, which is a sign of future apartment construction slowing. Looking at regional permit data compared to the previous month, permits are 36.2% higher in the Northeast, 3.8% higher in the Midwest, 1.3% lower in the South and 6.8% lower in the West.

Moderating Interest Rates, Pent-up Demand Push Single-Family Starts Higher2024-03-19T09:20:28-05:00

U.S. Financial Accounts Fourth Quarter Wealth Data

2024-03-13T11:18:52-05:00

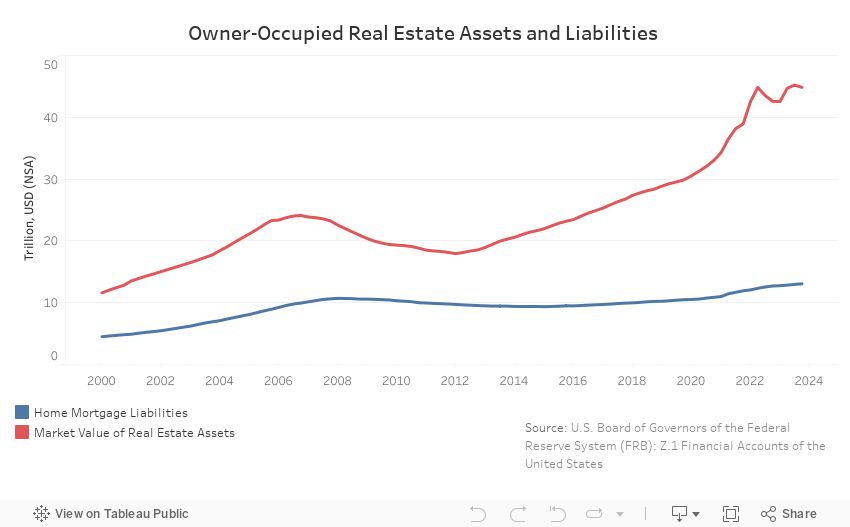
According to the 2023 fourth quarter release of the Federal Reserve Z.1 Financial Accounts of the United States , the market value of household real estate assets fell from $45.21 trillion to $44.84 trillion in the fourth quarter of 2023. Over the year, household real estate assets were 5.28% higher. Between the third and fourth quarters of 2023, the market value of household real estate assets fell by $365.85 billion, a 0.81% decrease. Total nonfinancial assets held by households and nonprofits fell by $551.886 billion to $57.9 trillion. Real estate owned by households is by far the largest share of households and nonprofit’s nonfinancial assets making up 77% of the market value. Nonprofit’s nonfinancial assets (real estate, equipment, and intellectual property) make up about 9%, while consumer durables make up the remaining 14% of nonfinancial assets in the balance sheet. Total financial assets for households and nonprofits grew by $5.56 trillion over the quarter to end the year at $118.83 trillion. Directly held stock holds the largest share of total financial assets at 27% ($32.00 trillion) Real estate secured liabilities of households’ balance sheets, i.e., mortgages, home equity loans, and HELOCs, increased 0.69% over the fourth quarter to $13.05 trillion,. Year-over-year, real estate liabilities have increased 2.81%. The level of one-to-four-family residential mortgages outstanding to end 2023 stood at $13.99 trillion. Of the parties that held these mortgages as liabilities, households held $13.05 trillion, nonfinancial corporate businesses held $20.7 billion, while nonfinancial noncorporate businesses held the remaining $920.5 billion. Since 2003, the shares of these outstanding liabilities have remained consistent, with households holding above 92%. To end 2023, households held 93.3%, nonfinancial noncorporate businesses held 6.6%, while nonfinancial corporate businesses held 0.01% of the outstanding liabilities of one-to-four-family residential mortgages. Sectors that hold one-to-four-family residential mortgages as assets have seen little change over the past few years. The largest holder of these mortgages as assets continued to be Government Sponsored Entities (GSEs) which held $6.71 trillion or 48.0% of the assets. The second largest holder was Agency- and GSE-back mortgage pools, which held $2.40 trillion or 17.1%. Mortgage pools are a group of mortgages used as collateral for a mortgage-backed security. In the financial accounts, these mortgage pools equal the unpaid balances of the mortgages in the pools. The shift that occurred between the end of 2009 and 2010 between these two groups was due to new accounting rules in the first quarter of 2010 which required Freddie Mac and Fannie Mae (both GSEs) to move almost all their one-to-four-family mortgages on to their consolidated balance sheets. The GSE share of assets jumped from 3.9% in 2009 to 44.6% in 2010.

U.S. Financial Accounts Fourth Quarter Wealth Data2024-03-13T11:18:52-05:00

Examining Differences between Homeowner and Renter Wealth

2024-03-13T08:18:45-05:00

As examined in a previous post, homeownership plays an integral role in a household’s accumulation of wealth. This article further discusses the role of homeownership and examines the difference between homeowner and renter household balance sheets across assets, debt, and net worth. Households who own a primary residence (homeowners) build primary residence equity, while renters have zero residence equity. In the third quarter of 2023, CoreLogic’s homeowner report analysis detailed that U.S. homeowners with mortgages have seen their equity increase by a total of $1.1 trillion, a gain of 6.8% from the same period in 2022. In addition to primary residence equity, households who own a primary residence almost always own other assets as well. In contrast, households who do not own a primary residence (renters) neither accumulate wealth from home price appreciation, nor do they benefit from primary residence equity gains by paying down a home mortgage. Moreover, renters typically own a much smaller amount of other assets in aggregate than homeowners. Both home equity and non-residence equity account for the wealth gap between homeowners and renters. It is useful to keep in mind that almost all households will spend time as a renter and time as an owner. Prior NAHB analysis1 indicates about 9 out of 10 households will be homeowners during some period of their lifetime. As such, while homeownership is key pathway for wealth accumulation, the rental market plays a role in this process as well, as most households will rent before they own a home. ASSETS: In 2022, while almost every family owned some assets, homeowners own the vast majority of assets in aggregate. An analysis of the Survey of Consumer Finances (SCF) suggests that the households who owned a primary residence own most other assets in sum, such as other residential real estate2, vehicles, other non-financial assets3, business interests, stocks and bonds, retirement accounts, and other financial assets4. This is shown in Table 1 below. In contrast, renters who do not own a primary residence do not own as many other assets as homeowners. For example, in aggregate, homeowners owned 16 times more stocks and bonds than renters, 15 times more business interests and retirement accounts than renters. Table 2 presents median values of assets, debt, and net worth for all these homeowners and renters by age categories in 2022. Homeownership and housing wealth are strongly associated with age. The median value of the primary residence rose for homeowners aged between 35 and 44, reached the peak for homeowners aged 45 and 54, before declining for those aged 55 and above. Meanwhile, the median value of homeowners’ other financial assets continued to rise across these age categories. The median value of retirement accounts increased to $65,000 for homeowners aged between 45 and 54 and decreased as age increased. At the same time, the median value of business interests, other non-financial assets, and stocks and bonds among homeowners remained zero, indicating that fewer than half of homeowners own these assets at any age cohort. While Table 1 suggests that the owners of these assets are more likely to be homeowners, Table 2 indicates that a minority of homeowners own such assets. However, among households that owned these assets, the median value of business interests, other non-financial assets, and stocks and bonds grew over the entire age categories, as illustrated by Table 3 below. For renters, more than half of renters owned other financial assets, but they did not accumulate as they aged. Noticeably, fewer than half of renters owned retirement accounts, other residential real estate, other non-financial assets, and business interests at any age cohort. When renters were 65 or older, the median value of their financial assets and non-financial assets dropped by almost half from the median value when they were under 35. DEBT: On the debt side of homeowners’ balance sheets, the value of the primary home mortgage debt was the largest liability faced by homeowners. However, the median value of mortgage debt declined between the 35 to 64 age categories. More than half of homeowners above the age of 65 did not have mortgage debt (nor a balance on any of the other major debt categories). For renters, the value of credit card and installment debt was the largest liability in their debt category. The median value of credit card and installment debt declined between the 35 to 64 age categories and was zero for renters aged 65 or older. NET WORTH: Net worth, the measure of households’ wealth, is the difference between families’ assets and liabilities. An analysis of the 2022 SCF found that homeowners had a median net worth of $396,000, while renters had the median net worth of just $10,400. Thus, homeowners are wealthier than renters. Among homeowners, the primary residence equity was the largest category of their net worth. However, for renters, the non-primary residence equity was the larger portion of their net worth, reflecting the accumulation of other assets by renters in their life stages, as illustrated in Table 2. Across homeowners, the median amount of primary residence equity rose successively with age, largely reflecting a lower amount of mortgage debt as opposed to a higher home value. In 2022, the median net worth for homeowners was about 38 times the median net worth for renters. Excluding the primary residence equity from net worth, the median non-residence equity of homeowners was 15 times that of renters.   Note: 1 Ford, C. (2019). “Lifetime Homeownership and Homeownership Survival Rates Using the National Longitudinal Survey of Youth,” NAHB Special Studies, November 1, 2019. https://www.nahb.org/-/media/1057BA30B7A94167A26D3AC1F7A6B498.ashx 2 Other residential real estate includes land contracts/notes household has made, properties other than the principal residence that are coded as 1-4 family residences, time shares, and vacation homes. 3 Other non-financial assets defined as total value of miscellaneous assets minus other financial assets. 4 Other financial assets include loans from the household to someone else, future proceeds, royalties, futures, non-public stock, deferred compensation, oil/gas/mineral investments, and cash, not elsewhere classified. 5 According to the SCF, the term “families”, used in the SCF, is more comparable with the U.S. Census Bureau definition of “households” than with its use of “families”. More information can be found here: https://www.federalreserve.gov/publications/files/scf17.pdf.

Examining Differences between Homeowner and Renter Wealth2024-03-13T08:18:45-05:00

Job Growth Continues to be Strong Across Most States at the Start of 2024

2024-03-11T15:21:16-05:00

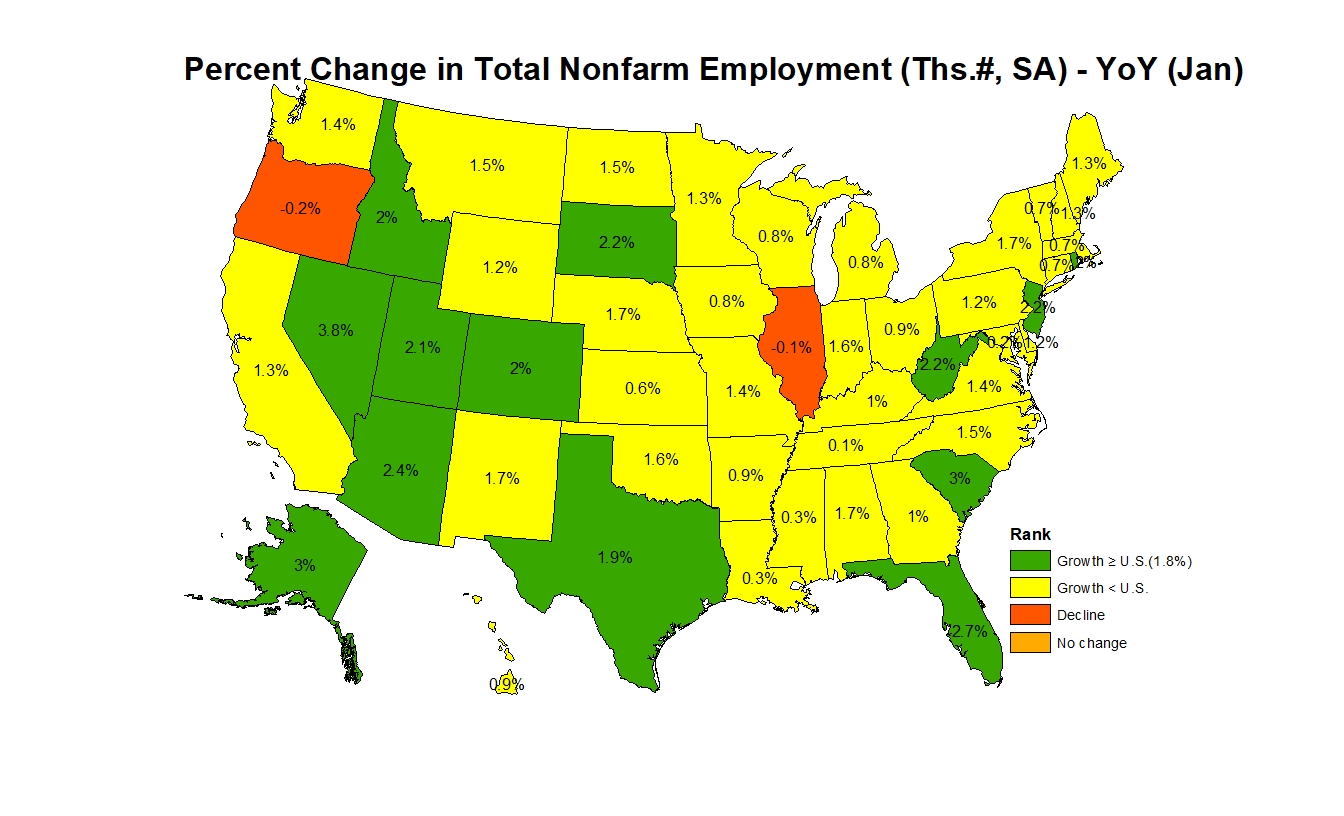
Nonfarm payroll employment increased in 42 states and the District of Columbia in January compared to the previous month, while eight states saw a decrease. According to the Bureau of Labor Statistics, nationwide total nonfarm payroll employment increased by 229,000 in January, following a gain of 290,000 jobs in December . On a month-over-month basis, employment data was most favorable in New York, which added 59,300 jobs, followed by California (+58,100), and then Florida (+38,800). A total of 17,100 jobs were lost across eight states, with Oregon reporting the steepest job losses at 4,900. In percentage terms, employment in Vermont increased the highest at 0.6%, while South Dakota saw the biggest decline at 0.4% between December and January. Year-over-year ending in January, 2.8 million jobs have been added to the labor market. Except for Oregon and Illinois, all other states and the District of Columbia added jobs compared to a year ago. The range of job gains spanned from 2,200 jobs in Vermont to 263,900 jobs in Texas. Conversely, Oregon and Illinois lost a total of 11,500 jobs on a year-over-year basis. In percentage terms, Nevada reported the highest increase at 3.8%, while Oregon showed the largest decrease at 0.2% compared to a year ago. Across the nation, construction sector jobs data[1]—which includes both residential and non-residential construction— showed that 32 states reported an increase in January compared to December, while 17 states lost construction sector jobs. The remaining two, Missouri and the District of Columbia reported no change on a month-over-month basis. North Carolina, with the highest increase, added 4,000 construction jobs, while Illinois, on the other end of the spectrum, lost 5,300 jobs. Overall, the construction industry added a net 19,000 jobs in January compared to the previous month. In percentage terms, Hawaii, Mississippi, and Arkansas reported the highest increase at 2.3% and Illinois reported the largest decline at 2.3%. Year-over-year, construction sector jobs in the U.S. increased by 218,000, which is a 2.8% increase compared to the January 2023 level. California added 44,600 jobs, which was the largest gain of any state, while New York lost 12,000 construction sector jobs. In percentage terms, South Dakota had the highest annual growth rate in the construction sector at 11.3%. Over this period, the District of Columbia reported the largest decline of 5.1%. [1] For this analysis, BLS combined employment totals for mining, logging, and construction are treated as construction employment for the District of Columbia, Delaware, and Hawaii.

Job Growth Continues to be Strong Across Most States at the Start of 20242024-03-11T15:21:16-05:00

Solid Job Growth in February

2024-03-08T12:25:34-06:00

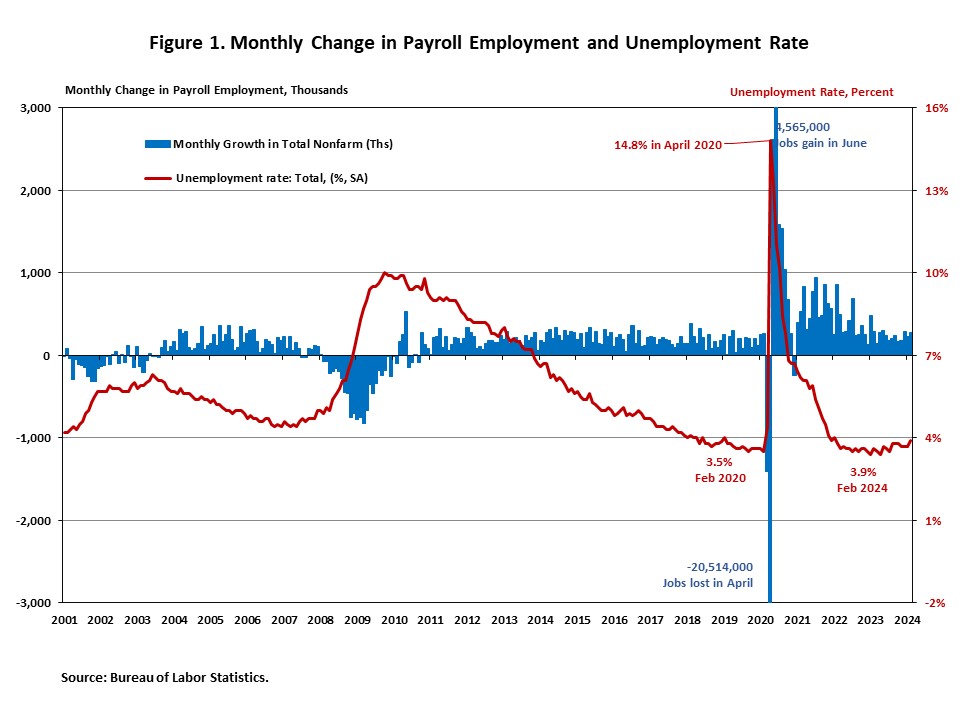
In February, job gains continued despite elevated interest rates. The unemployment rate increased while the labor force participation rate held steady. February’s jobs report shows that the labor market remains resilient but shows signs of slowing. Additionally, wage growth slowed slightly in February. On a year-over-year basis (YOY), wages grew 4.3% in February, following a 4.4% increase in January. This is 0.5 percentage points lower than a year ago. Wage growth is positive if matched by productivity growth. If not, it can be a sign of lingering inflation. Total nonfarm payroll employment increased by 275,000 in February, greater than the downwardly revised increase of 229,000 jobs in January, as reported in the Employment Situation Summary. There were significant downward revisions to the initial reported job gains for December and January. The monthly change in total nonfarm payroll employment for December was revised down by 43,000, from +333,000 to +290,000, while the change for January was revised down by 124,000 from +353,000 to +229,000. Combined, the revisions were 167,000 lower than the original estimates. Despite restrictive monetary policy, about 6.9 million jobs have been created since March 2022, when the Fed enacted the first interest rate hike of this cycle. In February, the unemployment rate increased by 0.2 percentage points to 3.9%, after holding at 3.7% for three straight months. This marks the highest level since January 2022. The number of unemployed persons rose by 334,000 to 6.5 million, while the number of employed persons declined by 184,000. Meanwhile, the labor force participation rate, the proportion of the population either looking for a job or already holding a job, was unchanged at 62.5% for the third consecutive month. Moreover, the labor force participation rate for people aged between 25 and 54 rose 0.2 percentage points to 83.5%. While the overall labor force participation rate is still below its pre-pandemic levels at the beginning of 2020, the rate for people aged between 25 and 54 exceeds the pre-pandemic level of 83.1%. For industry sectors, employment in health care (+67,000), government (+52,000), food services and drinking places (+42,000), social assistance (+24,000), and transportation and warehousing (+20,000) increased. Employment in the overall construction sector increased by 23,000 in February, following an upwardly revised 19,000 gains in January. While residential construction lost 1,200 jobs, non-residential construction employment added 24,200 jobs for the month. Residential construction employment now stands at 3.3 million in February, broken down as 936,000 builders and 2.4 million residential specialty trade contractors. The 6-month moving average of job gains for residential construction was 4,433 a month. Over the last 12 months, home builders and remodelers added 56,800 jobs on a net basis. Since the low point following the Great Recession, residential construction has gained 1,348,500 positions. In February, the unemployment rate for construction workers was unchanged at 5.1% on a seasonally adjusted basis. The unemployment rate for construction workers remained at a relatively lower level, after reaching 14.2% in April 2020, due to the housing demand impact of the COVID-19 pandemic.

Solid Job Growth in February2024-03-08T12:25:34-06:00

About My Work

Phasellus non ante ac dui sagittis volutpat. Curabitur a quam nisl. Nam est elit, congue et quam id, laoreet consequat erat. Aenean porta placerat efficitur. Vestibulum et dictum massa, ac finibus turpis.

Recent Works

Recent Posts