Inflation Picks Up as Tariffs Take Hold
Inflation rose to a 4-month high in June as consumer prices began to reflect tariff policy. The Consumer Price Index increased from 2.4% in May to 2.7% in June year-over-year, according to the Bureau of Labor Statistics’ report. Despite the increase, core inflation came in softer than expected, suggesting full tariff impacts will likely push inflation even higher in the coming months. Meanwhile, housing inflation continued to show signs of cooling and matched the lowest level since November 2021.
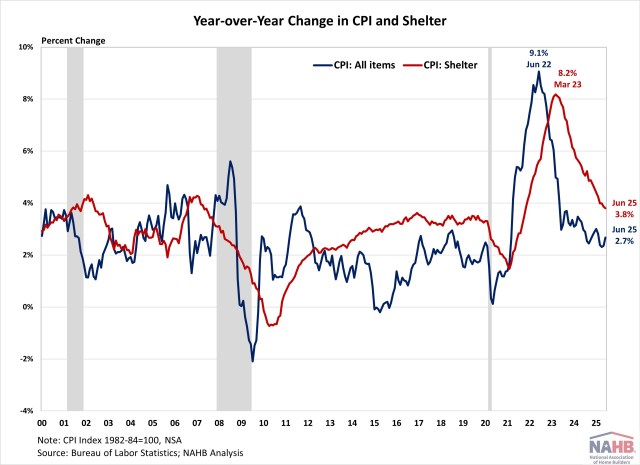
During the past twelve months, on a non-seasonally adjusted basis, the Consumer Price Index rose by 2.7% in June, the highest since February 2025. Excluding the volatile food and energy components, the “core” CPI increased by 2.9% over the past twelve months. A large portion of the “core” CPI is the housing shelter index, which increased 3.8% over the year, the lowest reading since November 2021. Meanwhile, the component index of food rose by 3.0%, and the energy component index fell by 0.8%.
On a monthly basis, the CPI rose by 0.3% in June (seasonally adjusted), after a 0.1% increase in May. The “core” CPI increased by 0.2% in June.
The price index for a broad set of energy sources rose by 0.9% in June, with increases across all components including fuel oil (+1.3%), gasoline (+1.0%), electricity (+1.0%) and natural gas (+0.5%). Meanwhile, the food index rose by 0.3%, the same increase in May. The index for food away from home increased by 0.4% and the index for food at home rose by 0.3%.
The index for shelter (+0.2%) was the largest contributor to the monthly increase in all items index. Other top contributors that rose in June include indexes for household furnishings and operations (+0.1%), medical care (+0.5%), recreation (+0.4%), apparel (+0.4%) as well as personal care (+0.3%). Meanwhile, the index for used cars and trucks (-0.7%), new vehicles (-0.3%), and airline fares (-0.1%) were among the few major indexes that decreased over the month.
The index for shelter makes up more than 40% of the “core” CPI, rising by 0.2% in June, following an increase of 0.3% in May. The index for owners’ equivalent rent (OER) rose by 0.3% and index for rent of primary residence (RPR) increased by 0.2% over the month. Despite the moderation, shelter costs remained the largest contributors to headline inflation.

While the Fed rate cuts could ease some housing market pressure, its ability to address rising housing costs is limited, as these increases are driven by a lack of affordable supply and increasing development costs. Tight monetary policy actually hurts housing supply by increasing AD&C financing costs. This can be seen on the graph below, as shelter costs continued rising despite Fed policy tightening in 2022. Additional housing supply is the primary solution to tame housing inflation and overall inflation. This emphasizes why the cost of construction, including the cost of building materials, matters not just for housing but also the inflation outlook and the path of future monetary policy.
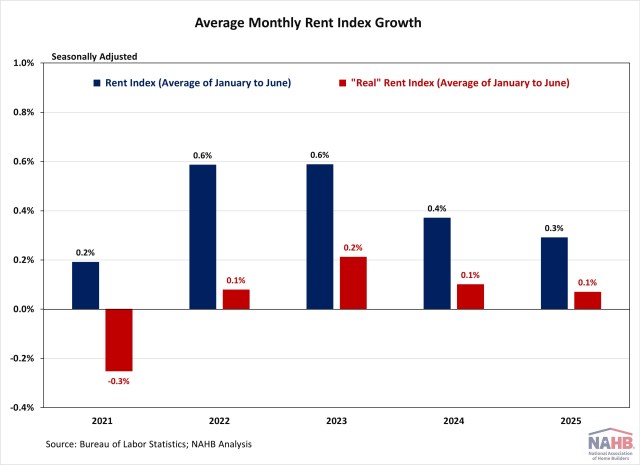
NAHB constructs a “real” rent index to indicate whether inflation in rents is faster or slower than core inflation. It provides insight into the supply and demand conditions for rental housing. When inflation in rents is rising faster than core inflation, the real rent index rises and vice versa. The real rent index is calculated by dividing the price index for rent by the core CPI (to exclude the volatile food and energy components). In June, the Real Rent Index remained unchanged. Over the first six months of 2025, the average monthly growth rate held steady at 0.1%, unchanged from the same period in 2024.
Discover more from Eye On Housing
Subscribe to get the latest posts sent to your email.