House Price Appreciation by State and Metro Area: First Quarter 2025
Jing Fu
June 10, 2025
FHFA HPI,Home Sales and Prices,house price appreciation,house prices,local data,metro data,state data
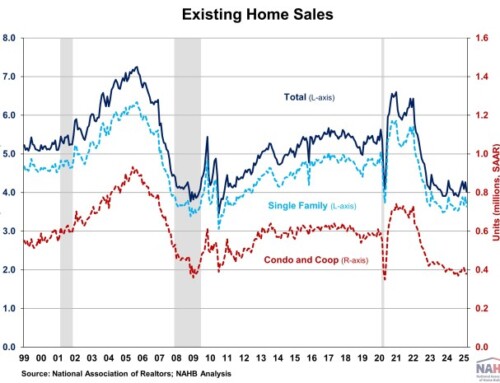
House price growth slowed in the first quarter of 2025, partly due to a decline in demand and an increase in supply. Persistent high mortgage rates and increased inventory combined to ease upward pressure on house prices. These factors signaled a cooling market, following rapid gains seen in previous years.
Nationally, according to the quarterly all-transactions House Price Index (HPI) released by the Federal Housing Finance Agency (FHFA), U.S. house prices rose 4.7% in the first quarter of 2025, compared to the first quarter of 2024. This year-over-year (YoY) rate was lower than the previous quarter’s rate of 5.5%. The FHFA’s all-transactions HPI tracks average price changes based on repeat sales and refinancings of the same single-family properties. It offers insights not only at the national level but also across states and metropolitan areas.

Between the first quarter of 2024 and the first quarter of 2025, all 50 states and the District of Columbia experienced positive house price appreciation, ranging from 1.0% to 8.4%. Connecticut and Rhode Island topped the house price appreciation list with an 8.4% gain each, followed by New Jersey with a 7.8% gain. On the opposite end, Louisiana recorded the lowest house price appreciation at 1.0%. Out of all 50 states and the District of Columbia, 26 states exceeded the national YoY growth rate of 4.7%. However, on a quarterly basis, home price appreciation slowed in 39 states compared to the fourth quarter of 2024, highlighting a broad-based deceleration in the housing market.

House price growth widely varied across U.S. metro areas year-over-year, ranging from -7.0% to +23.0%. Rome, GA recorded the largest decline in house prices, whereas Johnstown, PA posted the highest increase over the previous four quarters. In the first quarter of 2025, 28 metro areas, in reddish color on the map above, experienced negative house price appreciation. Meanwhile, 356 metro areas experienced price increases.
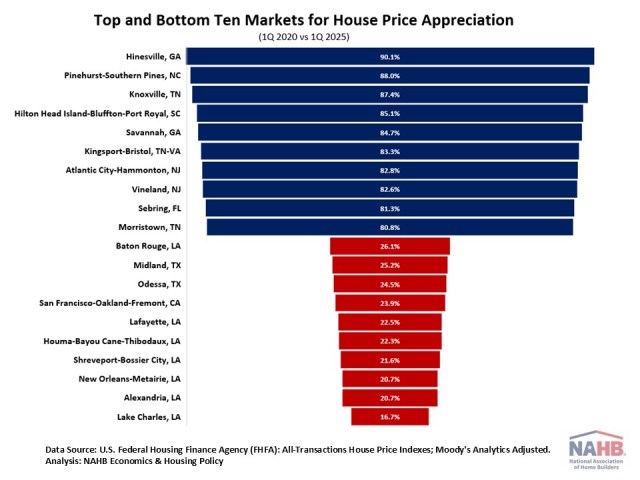
Since the onset of the COVID-19 pandemic, house prices have surged nationally. Between the first quarter of 2020 and the first quarter of 2025, house prices rose by 54.9% nationwide. More than half of metro areas outpaced this national price growth rate of 54.9%.
The table below highlights the top ten and bottom ten markets for house price appreciation during this five-year period. Among all the metro areas, house price appreciation ranged from 16.7% to 90.1%. Hinesville, GA led the nation with the highest house price appreciation. Lake Charles, LA recorded the lowest appreciation, marking its fourth consecutive quarter at the bottom.
Discover more from Eye On Housing
Subscribe to get the latest posts sent to your email.