Which Local Markets Track National Trends the Most: 2024 Multifamily MAI
Web Master
November 7, 2025
Following the release of the 2024 single-family MAI last week, the National Association of Home Builders developed the Multifamily Market Association Index (MAI) to measure how closely multifamily building permits in metro areas follow national patterns. By comparing local and national trends, the MAI helps industry leaders and forecasters better understand and predict housing market activity.
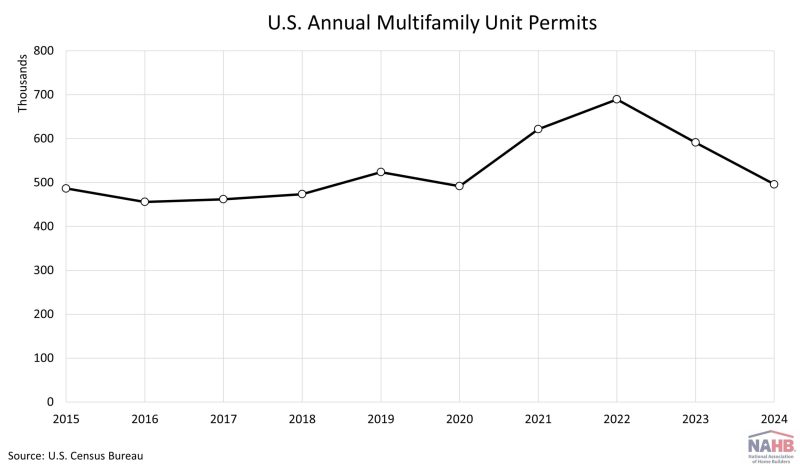
Nationally, multifamily permits displayed little variation over the second half of the 2010s. Permit levels began growing significantly during the pandemic and peaked at nearly 700,000 in 2022. However, both 2023 and 2024 reported declines, with 2024 having 496,000 units permitted, closer to pre-2020 levels.
The MAI uses 2015-2024 multifamily permit data to create five- and ten-year correlations for each metropolitan statistical area (MSA), showing their similarity to national patterns. The five- and ten-year correlations are then averaged, with more weight given to the five-year correlation. The resulting correlation coefficient ranges from negative one to positive one, indicating the strength and direction of the relationship between local and national trends.
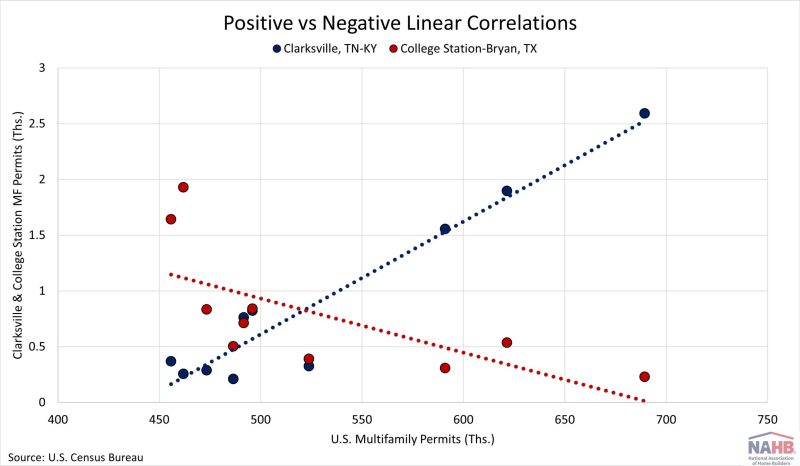
The MSA that had the highest associations with the national trend was Clarksville, TN-KY with a correlation of 0.97, while the MSA that recorded the lowest association with the national trend was College Station-Bryan, TX. The scatter plot below illustrates the linear relationship between these MSAs and the national trend. For example, when national permit levels rose near 700,000, Clarksville (positive correlation) also had relatively high permit levels of around 2,500. At the same time, College Station-Bryan (negative correlation) had relatively low permits of about 230.
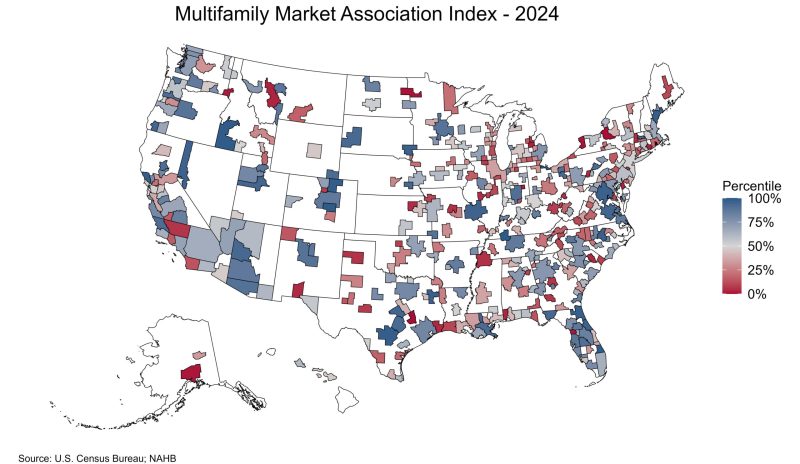
Of the 387 metro areas included in the multifamily MAI, the average correlation is 0.17. In total, 241 MSAs had a correlation greater than zero, and 145 MSAs had less than zero. One MSA had an average correlation of zero (Morgantown, WV), with no multifamily permits in the last five years. A positive correlation is expected as MSAs in total accounted for almost 95% of all multifamily permits in the U.S. on average between 2015 and 2024. A complete list of the MSA correlations is found here and shown on the map below.
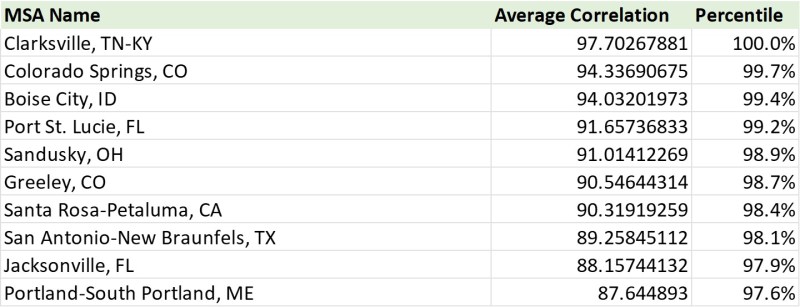
Additionally, below are the top ten and bottom ten in terms of the Multifamily MAI.

Discover more from Eye On Housing
Subscribe to get the latest posts sent to your email.