How Quickly Do Prices Respond to Monetary Policy?
As economist Milton Friedman once quipped, monetary policy has a history of operating with “long and variable lags.”[1] What Friedman was expressing is that it takes some time for the true effects of monetary policy, like the changing of the federal funds rate, to permeate completely through the larger economy. While some industries, like housing, are extremely rate-sensitive, there are others that are less so. Given the current inflation challenge, the question then becomes: how does monetary policy affect inflation across a diverse economy like the United States?
This was the question that Leila Bengali and Zoe Arnaut, researchers at the Federal Reserve Board of San Francisco (FSBSF), asked in a recent FSBSF economic letter article, “How Quickly Do Prices Response to Monetary Policy” [2]. The economists examined which components that make up the Personal Consumption Expenditures (PCE) Index[3], an inflation measurement produced by the Bureau of Economic Analysis (BEA), are the most and least responsive to changes in the federal funds rate. While the Federal Reserve makes decisions “based on the totality of the incoming data”[4] including the more popular Consumer Price Index (CPI)[5] produced by the Bureau of Labor Statistics (BLS), their preferred inflation measure is PCE. This is the reason why the researchers focused on this specific index.
Figure 1 represents how selected components would be affected over a four-year period if the federal funds rate increased by one percentage point.[6] The color of the bars is separated using the median cumulative percent price decline over this period: blue is the top 50% of all declines, while red is the bottom 50%.
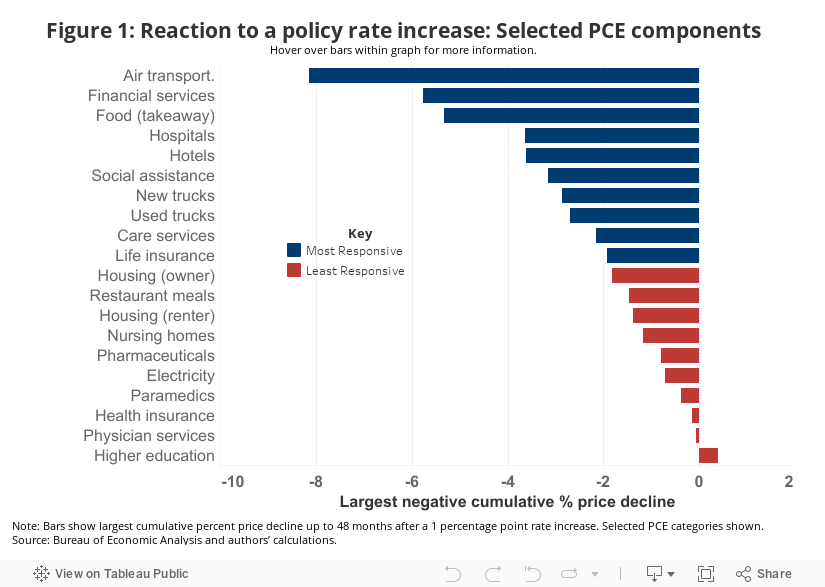
Both housing components (owner and renter) are classified in red or ‘least-responsive’, which might appear to be counterintuitive given how the latest tightening cycle starting in early 2022 has affected the residential industry. The NAHB/Wells Fargo Housing Market Index (HMI) declined every month in 2022, mortgage rates rose almost to 8%, and existing home sales fell to historically low levels. However, as the shelter component of CPI remains elevated, this less than expected responsive nature of housing could partially explain why the dramatic increase in the federal funds rate has yet to push this part of inflation down further compared to other categories.
Figure 2 illustrates this point by showing both groups along with headline PCE inflation with their respective year-over-year changes since 2019. The blue shaded area is when the Federal Reserve lowered the federal funds rate, while the yellow vertical line is where the Fed started the most recent tightening cycle.
The most responsive grouping (as defined by Figure 1 above) has experienced greater volatility than the least responsive grouping over this period. Especially as home prices have experienced minimal declines, this would provide further evidence for the housing components of inflation (i.e., prices) being somewhat less responsive to monetary policy. It is important to note that this does not suggest that the overall housing industry is not interest rate sensitive, but rather, that other sectors like the financial sectors responded faster.
However, and NAHB has stated this repeatedly, this “less” than expected response for housing is a function of the microeconomic situation that housing is experiencing. Shelter inflation is elevated and slow to respond to tightening conditions because higher housing costs are due to more than simply macroeconomic and monetary policy conditions. In fact, the dominant and persistent characteristic of the housing market is a lack of supply. Also, higher interest rates hurt the ability of the home building sector to provide more supply and tame shelter inflation, by increasing the cost of financing of land development and residential construction. This may be the reason for the somewhat counterintuitive findings of the Fed researchers.
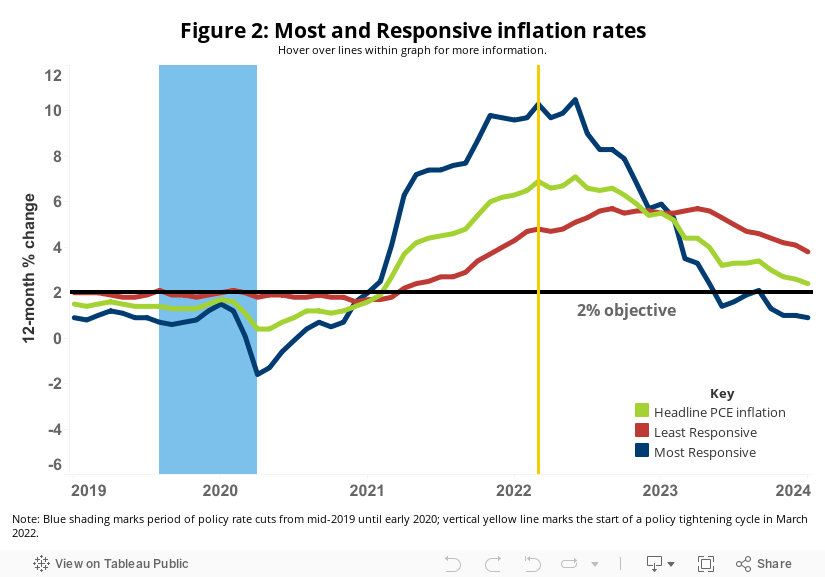
The Federal Reserve has a dual mandate[7] given by Congress, which instructs them to achieve price stability (i.e., controlling inflation) and maximize sustainable employment (i.e., controlling unemployment). To accomplish the first part, the Federal Reserve has targeted an annual rate of inflation at 2%. As Figure 2 showcases, while the headline PCE remains above this target, the most responsive grouping of PCE is, in fact, below 2% and has been for many months. This leads one to conclude that what is preventing the Federal Reserve from achieving its desired inflation target is due to the least responsive components of the index.
Figure 3 details this case with the bars representing the contributions of the two groupings (most and least responsive) to headline PCE inflation and the yellow line is the federal funds rate. The researchers were able to draw two conclusions from this chart:
- “[The] rate cuts from 2019 to early 2020 could have contributed upward price pressures starting in mid- to late 2020 and thus could explain some of the rise in inflation over this period.”
- “The tightening cycle that began in March 2022 likely started putting downward pressure on prices in mid-2023 and will continue to do so in the near term.”
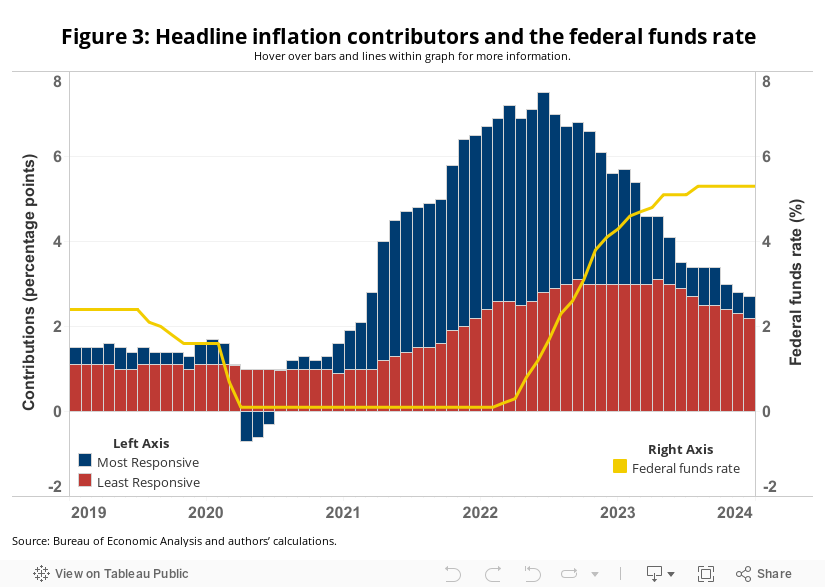
Nevertheless, even though there are some who suggest that these monetary policy lags have shortened[8], the researchers do not believe that the drop in inflation after the first rate hike in early-2022 was a direct effect of this policy action.
As evident by Figure 3, the fight to get inflation down to target is going to be much harder moving forward, especially given housing’s least responsive nature. As the researchers concluded, “[even] though inflation in the least responsive categories may come down because of other economic forces, less inflation is currently coming from categories that are most responsive to monetary policy, perhaps limiting policy impacts going forward.”
The Federal Reserve will have to weigh this question as 2024 continues: what are the trade-offs for reaching their inflation rate target to the larger economy if the remaining contributors of inflation are the least responsive to their policy actions?
More fundamentally, if housing (i.e., shelter inflation) is not responding as expected by the academic models, policymakers at the Fed (and more critically policymakers at the state and local level with direct control over issues like land development, zoning and home building) should define, communicate, and enact ways to permit additional housing supply to tackle the persistent sources of U.S. inflation – shelter.
The opinions expressed in this article do not necessarily reflect the views of the Federal Reserve Bank of San Francisco or the Federal Reserve System.
Notes:
[1] https://www.marketplace.org/2023/07/24/milton-friedmans-long-and-variable-lag-explained/#:~:text=long%20and%20variable%20lag.
[2] Bengali, L., & Arnaut, Z. (2024, April 8). How Quickly Do Prices Respond to Monetary Policy? Federal Reserve Bank of San Francisco. https://www.frbsf.org/research-and-insights/publications/economic-letter/2024/04/how-quickly-do-prices-respond-to-monetary-policy/
[3] https://www.bea.gov/data/personal-consumption-expenditures-price-index
[4] https://www.federalreserve.gov/mediacenter/files/FOMCpresconf20230726.pdf
[6] Specifically, the researchers used a statistical model called vector autoregression (VAR) which examines the relationship of multiple variables over time. As a result, VAR models can produce what are known as impulse response functions (IRF) which can show how one variable (prices) responds to a shock from another (federal funds rate). Figure 1 is the cumulative effect (i.e., adding all four individual year effects together) of this process.
[7] https://www.chicagofed.org/research/dual-mandate/dual-mandate
[8] https://www.kansascityfed.org/research/economic-bulletin/have-lags-in-monetary-policy-transmission-shortened/
Discover more from Eye On Housing
Subscribe to get the latest posts to your email.